TVG-Series System Guide v1-4 - SerVision
TVG-Series System Guide v1-4 - SerVision
TVG-Series System Guide v1-4 - SerVision

Create successful ePaper yourself
Turn your PDF publications into a flip-book with our unique Google optimized e-Paper software.
<strong>SerVision</strong><br />
<strong>TVG</strong> <strong>System</strong> <strong>Guide</strong><br />
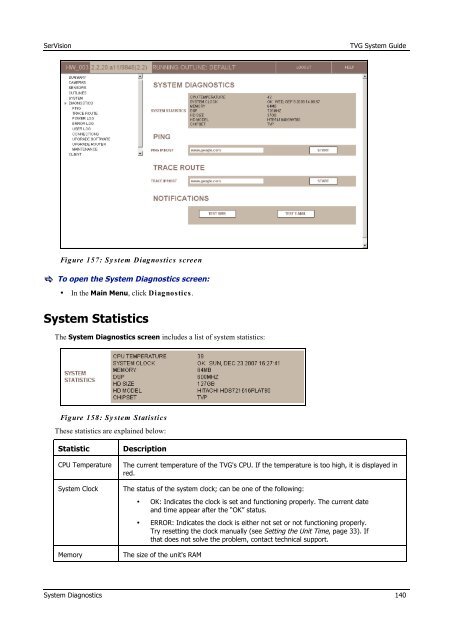
Figure 157: Sy stem Diagnostics screen<br />
To open the <strong>System</strong> Diagnostics screen:<br />
• In the Main Menu, click Diagnostics.<br />
<strong>System</strong> Statistics<br />
The <strong>System</strong> Diagnostics screen includes a list of system statistics:<br />
Figure 158: Sy stem Statistics<br />
These statistics are explained below:<br />
Statistic<br />
CPU Temperature<br />
<strong>System</strong> Clock<br />
Memory<br />
Description<br />
The current temperature of the <strong>TVG</strong>'s CPU. If the temperature is too high, it is displayed in<br />
red.<br />
The status of the system clock; can be one of the following:<br />
• OK: Indicates the clock is set and functioning properly. The current date<br />
and time appear after the “OK” status.<br />
• ERROR: Indicates the clock is either not set or not functioning properly.<br />
Try resetting the clock manually (see Setting the Unit Time, page 33). If<br />
that does not solve the problem, contact technical support.<br />
The size of the unit's RAM<br />
<strong>System</strong> Diagnostics 140