

Microseismic Monitoring and Geomechanical Modelling of CO2 - bris
Microseismic Monitoring and Geomechanical Modelling of CO2 - bris
Microseismic Monitoring and Geomechanical Modelling of CO2 - bris

Create successful ePaper yourself
Turn your PDF publications into a flip-book with our unique Google optimized e-Paper software.
5.5. SURFACE UPLIFT<br />
1<br />
0.9<br />
0.8<br />
S<strong>of</strong>t<br />
Med<br />
Stiff<br />
1<br />
0.9<br />
0.8<br />
1<br />
0.9<br />
0.8<br />
1<br />
0.9<br />
0.8<br />
0.7<br />
0.7<br />
0.7<br />
0.7<br />
0.6<br />
0.6<br />
0.6<br />
0.6<br />
K 0<br />
0.5<br />
γ 3<br />
0.5<br />
K 0<br />
0.5<br />
γ 3<br />
0.5<br />
0.4<br />
0.4<br />
0.4<br />
0.4<br />
0.3<br />
0.3<br />
0.3<br />
0.3<br />
0.2<br />
0.2<br />
0.2<br />
0.2<br />
0.1<br />
0.1<br />
0.1<br />
0.1<br />
0<br />
1 2 3<br />
0<br />
1 2 3<br />
0<br />
1 2 3<br />
0<br />
1 2 3<br />
(a)<br />
1<br />
1<br />
(b)<br />
0.9<br />
0.9<br />
0.8<br />
0.8<br />
0.7<br />
0.7<br />
0.6<br />
0.6<br />
K 0<br />
0.5<br />
γ 3<br />
0.5<br />
0.4<br />
0.4<br />
0.3<br />
0.3<br />
0.2<br />
0.2<br />
0.1<br />
0.1<br />
0<br />
1 2 3<br />
0<br />
1 2 3<br />
(c)<br />
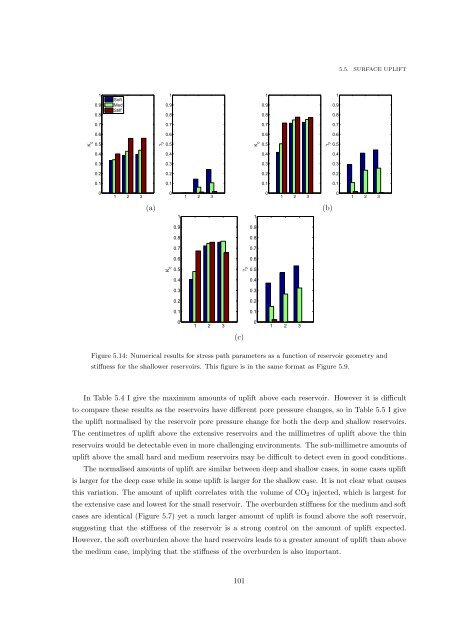
Figure 5.14: Numerical results for stress path parameters as a function <strong>of</strong> reservoir geometry <strong>and</strong><br />
stiffness for the shallower reservoirs. This figure is in the same format as Figure 5.9.<br />
In Table 5.4 I give the maximum amounts <strong>of</strong> uplift above each reservoir. However it is difficult<br />
to compare these results as the reservoirs have different pore pressure changes, so in Table 5.5 I give<br />
the uplift normalised by the reservoir pore pressure change for both the deep <strong>and</strong> shallow reservoirs.<br />
The centimetres <strong>of</strong> uplift above the extensive reservoirs <strong>and</strong> the millimetres <strong>of</strong> uplift above the thin<br />
reservoirs would be detectable even in more challenging environments. The sub-millimetre amounts <strong>of</strong><br />
uplift above the small hard <strong>and</strong> medium reservoirs may be difficult to detect even in good conditions.<br />
The normalised amounts <strong>of</strong> uplift are similar between deep <strong>and</strong> shallow cases, in some cases uplift<br />
is larger for the deep case while in some uplift is larger for the shallow case. It is not clear what causes<br />
this variation. The amount <strong>of</strong> uplift correlates with the volume <strong>of</strong> CO 2 injected, which is largest for<br />
the extensive case <strong>and</strong> lowest for the small reservoir. The overburden stiffness for the medium <strong>and</strong> s<strong>of</strong>t<br />
cases are identical (Figure 5.7) yet a much larger amount <strong>of</strong> uplift is found above the s<strong>of</strong>t reservoir,<br />
suggesting that the stiffness <strong>of</strong> the reservoir is a strong control on the amount <strong>of</strong> uplift expected.<br />
However, the s<strong>of</strong>t overburden above the hard reservoirs leads to a greater amount <strong>of</strong> uplift than above<br />
the medium case, implying that the stiffness <strong>of</strong> the overburden is also important.<br />
101


