

Microseismic Monitoring and Geomechanical Modelling of CO2 - bris
Microseismic Monitoring and Geomechanical Modelling of CO2 - bris
Microseismic Monitoring and Geomechanical Modelling of CO2 - bris

You also want an ePaper? Increase the reach of your titles
YUMPU automatically turns print PDFs into web optimized ePapers that Google loves.
8.4. A SOFTER RESERVOIR<br />
8.4 A s<strong>of</strong>ter reservoir<br />
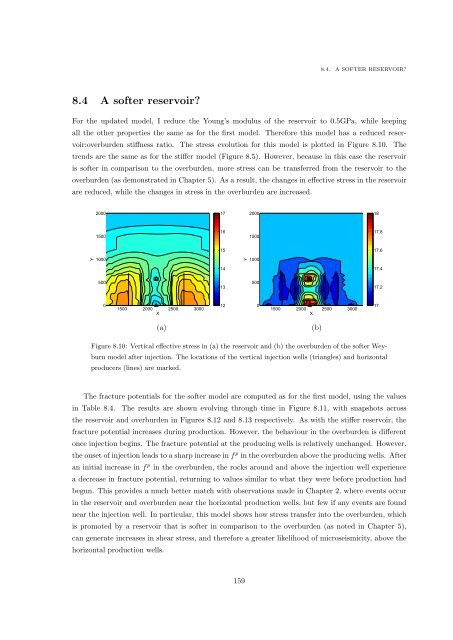
For the updated model, I reduce the Young’s modulus <strong>of</strong> the reservoir to 0.5GPa, while keeping<br />
all the other properties the same as for the first model. Therefore this model has a reduced reservoir:overburden<br />
stiffness ratio. The stress evolution for this model is plotted in Figure 8.10. The<br />
trends are the same as for the stiffer model (Figure 8.5). However, because in this case the reservoir<br />
is s<strong>of</strong>ter in comparison to the overburden, more stress can be transferred from the reservoir to the<br />
overburden (as demonstrated in Chapter 5). As a result, the changes in effective stress in the reservoir<br />
are reduced, while the changes in stress in the overburden are increased.<br />
2000<br />
17<br />
2000<br />
18<br />
1500<br />
16<br />
1500<br />
17.8<br />
15<br />
17.6<br />
Y<br />
1000<br />
Y<br />
1000<br />
14<br />
17.4<br />
500<br />
13<br />
500<br />
17.2<br />
0<br />
1500 2000 2500 3000<br />
X<br />
12<br />
0<br />
1500 2000 2500 3000<br />
X<br />
17<br />
(a)<br />
(b)<br />
Figure 8.10: Vertical effective stress in (a) the reservoir <strong>and</strong> (b) the overburden <strong>of</strong> the s<strong>of</strong>ter Weyburn<br />
model after injection. The locations <strong>of</strong> the vertical injection wells (triangles) <strong>and</strong> horizontal<br />
producers (lines) are marked.<br />
The fracture potentials for the s<strong>of</strong>ter model are computed as for the first model, using the values<br />
in Table 8.4. The results are shown evolving through time in Figure 8.11, with snapshots across<br />
the reservoir <strong>and</strong> overburden in Figures 8.12 <strong>and</strong> 8.13 respectively. As with the stiffer reservoir, the<br />
fracture potential increases during production. However, the behaviour in the overburden is different<br />
once injection begins. The fracture potential at the producing wells is relatively unchanged. However,<br />
the onset <strong>of</strong> injection leads to a sharp increase in f p in the overburden above the producing wells. After<br />
an initial increase in f p in the overburden, the rocks around <strong>and</strong> above the injection well experience<br />
a decrease in fracture potential, returning to values similar to what they were before production had<br />
begun. This provides a much better match with observations made in Chapter 2, where events occur<br />
in the reservoir <strong>and</strong> overburden near the horizontal production wells, but few if any events are found<br />
near the injection well. In particular, this model shows how stress transfer into the overburden, which<br />
is promoted by a reservoir that is s<strong>of</strong>ter in comparison to the overburden (as noted in Chapter 5),<br />
can generate increases in shear stress, <strong>and</strong> therefore a greater likelihood <strong>of</strong> microseismicity, above the<br />
horizontal production wells.<br />
159


