

Microseismic Monitoring and Geomechanical Modelling of CO2 - bris
Microseismic Monitoring and Geomechanical Modelling of CO2 - bris
Microseismic Monitoring and Geomechanical Modelling of CO2 - bris

You also want an ePaper? Increase the reach of your titles
YUMPU automatically turns print PDFs into web optimized ePapers that Google loves.
CHAPTER 4. A COMPARISON OF MICROSEISMIC MONITORING OF FRACTURE STIMULATION DUE TO WATER<br />
VERSUS CO 2 INJECTION<br />
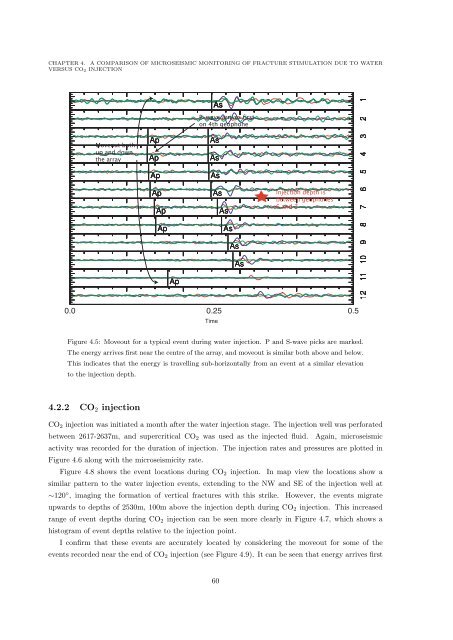
P-wave arrives first<br />
on 4th geophone<br />
Moveout both<br />
up <strong>and</strong> down<br />
the array<br />
Injection depth is<br />
between geophones<br />
6 <strong>and</strong> 7<br />
0.0 0.25 0.5<br />
Time<br />
Figure 4.5: Moveout for a typical event during water injection. P <strong>and</strong> S-wave picks are marked.<br />
The energy arrives first near the centre <strong>of</strong> the array, <strong>and</strong> moveout is similar both above <strong>and</strong> below.<br />
This indicates that the energy is travelling sub-horizontally from an event at a similar elevation<br />
to the injection depth.<br />
4.2.2 CO 2 injection<br />
CO 2 injection was initiated a month after the water injection stage. The injection well was perforated<br />
between 2617-2637m, <strong>and</strong> supercritical CO 2 was used as the injected fluid. Again, microseismic<br />
activity was recorded for the duration <strong>of</strong> injection. The injection rates <strong>and</strong> pressures are plotted in<br />
Figure 4.6 along with the microseismicity rate.<br />
Figure 4.8 shows the event locations during CO 2 injection. In map view the locations show a<br />
similar pattern to the water injection events, extending to the NW <strong>and</strong> SE <strong>of</strong> the injection well at<br />
∼120 ◦ , imaging the formation <strong>of</strong> vertical fractures with this strike. However, the events migrate<br />
upwards to depths <strong>of</strong> 2530m, 100m above the injection depth during CO 2 injection. This increased<br />
range <strong>of</strong> event depths during CO 2 injection can be seen more clearly in Figure 4.7, which shows a<br />
histogram <strong>of</strong> event depths relative to the injection point.<br />
I confirm that these events are accurately located by considering the moveout for some <strong>of</strong> the<br />
events recorded near the end <strong>of</strong> CO 2 injection (see Figure 4.9). It can be seen that energy arrives first<br />
60


