

Microseismic Monitoring and Geomechanical Modelling of CO2 - bris
Microseismic Monitoring and Geomechanical Modelling of CO2 - bris
Microseismic Monitoring and Geomechanical Modelling of CO2 - bris

Create successful ePaper yourself
Turn your PDF publications into a flip-book with our unique Google optimized e-Paper software.
2.4. EVENT TIMING AND LOCATIONS<br />
Northing (m)<br />
500<br />
250<br />
0<br />
−250<br />
−500<br />
−500 −250 0 250 500<br />
Easting (m)<br />
(a)<br />
Depth (m)<br />
1000<br />
1100<br />
1200<br />
1300<br />
1400<br />
1500<br />
1600<br />
−500 −250 0 250 500<br />
Easting (m)<br />
(b)<br />
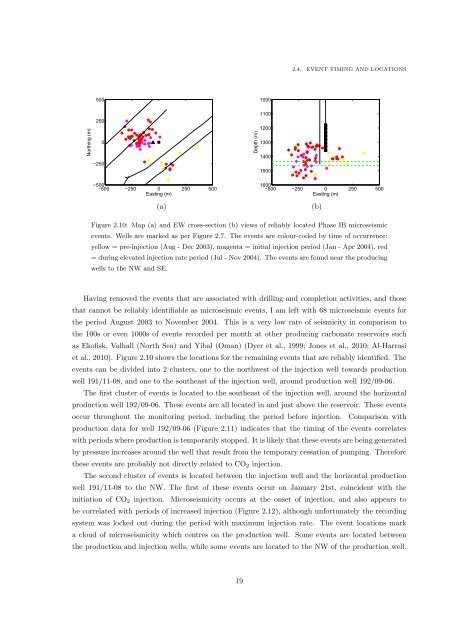
Figure 2.10: Map (a) <strong>and</strong> EW cross-section (b) views <strong>of</strong> reliably located Phase IB microseismic<br />
events. Wells are marked as per Figure 2.7. The events are colour-coded by time <strong>of</strong> occurrence:<br />
yellow = pre-injection (Aug - Dec 2003), magenta = initial injection period (Jan - Apr 2004), red<br />
= during elevated injection rate period (Jul - Nov 2004). The events are found near the producing<br />
wells to the NW <strong>and</strong> SE.<br />
Having removed the events that are associated with drilling <strong>and</strong> completion activities, <strong>and</strong> those<br />
that cannot be reliably identifiable as microseismic events, I am left with 68 microseismic events for<br />
the period August 2003 to November 2004. This is a very low rate <strong>of</strong> seismicity in comparison to<br />
the 100s or even 1000s <strong>of</strong> events recorded per month at other producing carbonate reservoirs such<br />
as Ek<strong>of</strong>isk, Valhall (North Sea) <strong>and</strong> Yibal (Oman) (Dyer et al., 1999; Jones et al., 2010; Al-Harrasi<br />
et al., 2010). Figure 2.10 shows the locations for the remaining events that are reliably identified. The<br />
events can be divided into 2 clusters, one to the northwest <strong>of</strong> the injection well towards production<br />
well 191/11-08, <strong>and</strong> one to the southeast <strong>of</strong> the injection well, around production well 192/09-06.<br />
The first cluster <strong>of</strong> events is located to the southeast <strong>of</strong> the injection well, around the horizontal<br />
production well 192/09-06. These events are all located in <strong>and</strong> just above the reservoir. These events<br />
occur throughout the monitoring period, including the period before injection. Comparison with<br />
production data for well 192/09-06 (Figure 2.11) indicates that the timing <strong>of</strong> the events correlates<br />
with periods where production is temporarily stopped. It is likely that these events are being generated<br />
by pressure increases around the well that result from the temporary cessation <strong>of</strong> pumping. Therefore<br />
these events are probably not directly related to CO 2 injection.<br />
The second cluster <strong>of</strong> events is located between the injection well <strong>and</strong> the horizontal production<br />
well 191/11-08 to the NW. The first <strong>of</strong> these events occur on January 21st, coincident with the<br />
initiation <strong>of</strong> CO 2 injection. <strong>Microseismic</strong>ity occurs at the onset <strong>of</strong> injection, <strong>and</strong> also appears to<br />
be correlated with periods <strong>of</strong> increased injection (Figure 2.12), although unfortunately the recording<br />
system was locked out during the period with maximum injection rate. The event locations mark<br />
a cloud <strong>of</strong> microseismicity which centres on the production well. Some events are located between<br />
the production <strong>and</strong> injection wells, while some events are located to the NW <strong>of</strong> the production well.<br />
19


