- Page 1:
Microseismic Monitoring and Geomech
- Page 5 and 6:
Abstract Capture of CO 2 produced a
- Page 7 and 8:
Author’s Declaration I declare th
- Page 9 and 10:
Acknowledgments There are many thin
- Page 11 and 12:
Table of Contents Abstract Author
- Page 13 and 14:
TABLE OF CONTENTS 5.4 Results . . .
- Page 15 and 16:
Preface ‘Research is not an end i
- Page 17 and 18:
6. D. Angus, J-M. Kendall, J.P. Ver
- Page 19 and 20:
1 Introduction A technology push ap
- Page 21 and 22:
1.2. CCS OVERVIEW Figure 1.2: CCS s
- Page 23 and 24:
1.3. THESIS OVERVIEW for CO 2 to be
- Page 25 and 26:
1.3. THESIS OVERVIEW as microseismi
- Page 27 and 28:
2 The Weyburn CO 2 injection projec
- Page 29 and 30:
2.2. WEYBURN GEOLOGICAL SETTING Fig
- Page 31 and 32:
2.2. WEYBURN GEOLOGICAL SETTING N F
- Page 33 and 34:
2.4. EVENT TIMING AND LOCATIONS 500
- Page 35 and 36:
2.4. EVENT TIMING AND LOCATIONS 500
- Page 37 and 38:
2.4. EVENT TIMING AND LOCATIONS Nor
- Page 39 and 40:
2.4. EVENT TIMING AND LOCATIONS Fig
- Page 41 and 42:
2.5. DISCUSSION 500 1000 1100 North
- Page 43 and 44:
2.6. SUMMARY 2.6 Summary • CO 2 s
- Page 45 and 46:
3 Inverting shear-wave splitting me
- Page 47 and 48:
3.2. INVERSION METHOD the additiona
- Page 49 and 50:
3.2. INVERSION METHOD 1. P-wave inc
- Page 51 and 52:
3.2. INVERSION METHOD 180 160 140 C
- Page 53 and 54:
3.2. INVERSION METHOD 2800 2800 260
- Page 55 and 56:
3.2. INVERSION METHOD Loop over γ,
- Page 57 and 58:
20 10 5 5 1 20 30 40 80 100 60 40 1
- Page 59 and 60:
3.4. SWS MEASUREMENTS AT WEYBURN th
- Page 61 and 62:
3.4. SWS MEASUREMENTS AT WEYBURN ei
- Page 63 and 64:
3.4. SWS MEASUREMENTS AT WEYBURN ξ
- Page 65 and 66:
3.4. SWS MEASUREMENTS AT WEYBURN da
- Page 67 and 68:
4 2 2 3.4. SWS MEASUREMENTS AT WEYB
- Page 69 and 70:
1 1 1 1 1 1 1 1 1 1 3.5. DISCUSSION
- Page 71 and 72:
3.6. SUMMARY 3.6 Summary • I have
- Page 73 and 74:
4 A comparison of microseismic moni
- Page 75 and 76:
4.2. EVENT LOCATIONS 2400 Velocity
- Page 77 and 78:
4.2. EVENT LOCATIONS 200 150 Northi
- Page 79 and 80:
4.3. EVENT MAGNITUDES Pressure (MPa
- Page 81 and 82:
4.3. EVENT MAGNITUDES 160 140 120 N
- Page 83 and 84:
4.4. SHEAR WAVE SPLITTING 50 −3 E
- Page 85 and 86:
4.5. INITIAL S-WAVE POLARISATION In
- Page 87 and 88:
4.5. INITIAL S-WAVE POLARISATION 6
- Page 89 and 90:
4.5. INITIAL S-WAVE POLARISATION of
- Page 91 and 92:
4.6. INTERPRETATION OF SHEAR WAVE S
- Page 93 and 94:
1 1 5 5 30 4.6. INTERPRETATION OF S
- Page 95 and 96:
80 4.6. INTERPRETATION OF SHEAR WAV
- Page 97 and 98:
2 3 3.5 4 5 2 1.8 1.4 4 4.6. INTERP
- Page 99 and 100:
4.7. DISCUSSION 4.7 Discussion The
- Page 101 and 102:
pressure, P fl σ ′ ij = σ ij
- Page 103 and 104:
5.2. EFFECTIVE STRESS AND STRESS PA
- Page 105 and 106:
5.3. NUMERICAL MODELLING 5.3.1 Flui
- Page 107 and 108:
5.3. NUMERICAL MODELLING MORE FLUID
- Page 109 and 110:
5.3. NUMERICAL MODELLING (a) (b) Fi
- Page 111 and 112:
5.4. RESULTS 0 500 1000 Depth (m) 1
- Page 113 and 114:
5.4. RESULTS 1 0.9 0.8 Soft Med Sti
- Page 115 and 116:
5.4. RESULTS Overburden Extension i
- Page 117 and 118: 5.4. RESULTS 1z:100x:100y 1z:100x:5
- Page 119 and 120: 5.5. SURFACE UPLIFT 1 0.9 0.8 Soft
- Page 121 and 122: 5.5. SURFACE UPLIFT Figure 5.17: Ma
- Page 123 and 124: 6 Generating anisotropic seismic mo
- Page 125 and 126: 6.2. STRESS-SENSITIVE ROCK PHYSICS
- Page 127 and 128: 6.3. A MICRO-STRUCTURAL MODEL FOR N
- Page 129 and 130: 6.3. A MICRO-STRUCTURAL MODEL FOR N
- Page 131 and 132: 6.3. A MICRO-STRUCTURAL MODEL FOR N
- Page 133 and 134: 6.3. A MICRO-STRUCTURAL MODEL FOR N
- Page 135 and 136: 6.3. A MICRO-STRUCTURAL MODEL FOR N
- Page 137 and 138: 6.3. A MICRO-STRUCTURAL MODEL FOR N
- Page 139 and 140: 6.3. A MICRO-STRUCTURAL MODEL FOR N
- Page 141 and 142: 6.3. A MICRO-STRUCTURAL MODEL FOR N
- Page 143 and 144: 6.3. A MICRO-STRUCTURAL MODEL FOR N
- Page 145 and 146: 6.4. CALIBRATION WITH LITERATURE DA
- Page 147 and 148: 6.4. CALIBRATION WITH LITERATURE DA
- Page 149 and 150: 6.5. COMPARISON OF ROCK PHYSICS MOD
- Page 151 and 152: 6.5. COMPARISON OF ROCK PHYSICS MOD
- Page 153 and 154: 7 Forward modelling of seismic prop
- Page 155 and 156: 7.2. SEISMODEL c⃝ WORKFLOW time s
- Page 157 and 158: 7.3. RESULTS FROM SIMPLE GEOMECHANI
- Page 159 and 160: 7.3. RESULTS FROM SIMPLE GEOMECHANI
- Page 161 and 162: 7.3. RESULTS FROM SIMPLE GEOMECHANI
- Page 163 and 164: 7.4. SUMMARY 7.4 Summary • I have
- Page 165 and 166: 8 Linking geomechanical modelling a
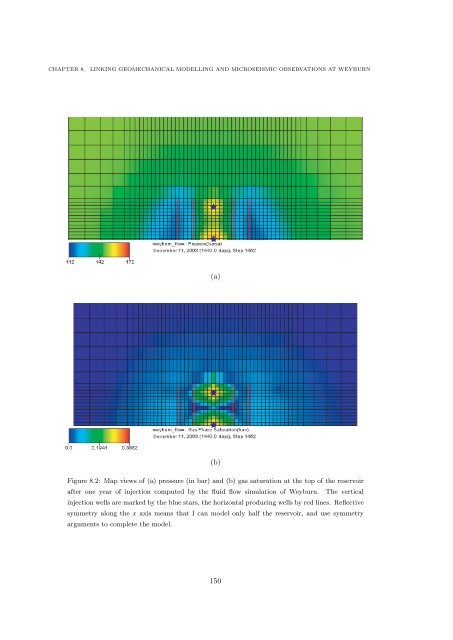
- Page 167: 8.2. MODEL DESCRIPTION Layer Thickn
- Page 171 and 172: 8.3. RESULTS Marl Vugg 0.8 0.8 Norm
- Page 173 and 174: 8.3. RESULTS 15 10 Injector Produce
- Page 175 and 176: 8.3. RESULTS 2000 15 2000 15 1500 1
- Page 177 and 178: 8.4. A SOFTER RESERVOIR 8.4 A softe
- Page 179 and 180: 8.4. A SOFTER RESERVOIR 2000 15 200
- Page 181 and 182: 8.4. A SOFTER RESERVOIR 2000 Max SW
- Page 183 and 184: 8.5. DISCUSSION pore-pressure being
- Page 185 and 186: 8.6. SUMMARY 8.6 Summary • I appl
- Page 187 and 188: 9 Conclusions Geological storage wi
- Page 189 and 190: calibrate. This model has been cali
- Page 191 and 192: 9.1. NOVEL CONTRIBUTIONS techniques
- Page 193 and 194: 9.2. FUTURE WORK Finally, the compa
- Page 195 and 196: Bibliography Abt, D. L., Fischer, K
- Page 197 and 198: BIBLIOGRAPHY Gassmann, F., 1951. Ub
- Page 199 and 200: BIBLIOGRAPHY Kendall, J.-M., Pilido
- Page 201 and 202: BIBLIOGRAPHY Sayers, C. M., 2002. S
- Page 203 and 204: BIBLIOGRAPHY White, D., 2009. Monit
- Page 205 and 206: A List of Symbols The table below l
- Page 207 and 208: B In Support of Carbon Capture and
- Page 209 and 210: Both China and India are aggressive
- Page 211 and 212: Utsira rock properties vary signifi