

Microseismic Monitoring and Geomechanical Modelling of CO2 - bris
Microseismic Monitoring and Geomechanical Modelling of CO2 - bris
Microseismic Monitoring and Geomechanical Modelling of CO2 - bris

You also want an ePaper? Increase the reach of your titles
YUMPU automatically turns print PDFs into web optimized ePapers that Google loves.
CHAPTER 4. A COMPARISON OF MICROSEISMIC MONITORING OF FRACTURE STIMULATION DUE TO WATER<br />
VERSUS CO 2 INJECTION<br />
P-wave arrives<br />
first at the top<br />
<strong>of</strong> the array<br />
Injection depth is<br />
between geophones<br />
3 <strong>and</strong> 4<br />
Moveout is<br />
consistent down<br />
the array<br />
0.0 0.25 0.5<br />
Time<br />
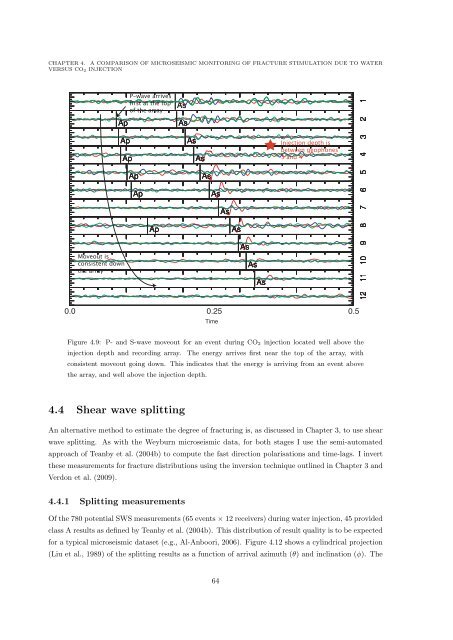
Figure 4.9: P- <strong>and</strong> S-wave moveout for an event during CO 2 injection located well above the<br />
injection depth <strong>and</strong> recording array. The energy arrives first near the top <strong>of</strong> the array, with<br />
consistent moveout going down. This indicates that the energy is arriving from an event above<br />
the array, <strong>and</strong> well above the injection depth.<br />
4.4 Shear wave splitting<br />
An alternative method to estimate the degree <strong>of</strong> fracturing is, as discussed in Chapter 3, to use shear<br />
wave splitting. As with the Weyburn microseismic data, for both stages I use the semi-automated<br />
approach <strong>of</strong> Teanby et al. (2004b) to compute the fast direction polarisations <strong>and</strong> time-lags. I invert<br />
these measurements for fracture distributions using the inversion technique outlined in Chapter 3 <strong>and</strong><br />
Verdon et al. (2009).<br />
4.4.1 Splitting measurements<br />
Of the 780 potential SWS measurements (65 events × 12 receivers) during water injection, 45 provided<br />
class A results as defined by Teanby et al. (2004b). This distribution <strong>of</strong> result quality is to be expected<br />
for a typical microseismic dataset (e.g., Al-Anboori, 2006). Figure 4.12 shows a cylindrical projection<br />
(Liu et al., 1989) <strong>of</strong> the splitting results as a function <strong>of</strong> arrival azimuth (θ) <strong>and</strong> inclination (ϕ). The<br />
64


