

Microseismic Monitoring and Geomechanical Modelling of CO2 - bris
Microseismic Monitoring and Geomechanical Modelling of CO2 - bris
Microseismic Monitoring and Geomechanical Modelling of CO2 - bris

You also want an ePaper? Increase the reach of your titles
YUMPU automatically turns print PDFs into web optimized ePapers that Google loves.
CHAPTER 6.<br />
GENERATING ANISOTROPIC SEISMIC MODELS BASED ON GEOMECHANICAL SIMULATION<br />
Sample Crack set a 0 ξ 0 Sample Crack set a 0 ξ 0<br />
α 11 0.0014 0.165 α 11 0.0006 0.590<br />
1784 α 22 0.0018 0.155 2194 α 22 0.0005 0.635<br />
α 33 0.0012 0.440 α 33 0.0007 0.740<br />
α 11 0.0019 0.315 α 11 0.0009 0.085<br />
1788 α 22 0.0044 0.280 Bere α 22 0.0009 0.085<br />
α 33 0.0014 0.475 α 33 0.0009 0.140<br />
α 11 0.0007 0.345 α 11 0.0005 0.150<br />
1909 α 22 0.0008 0.295 Penr α 22 0.0005 0.180<br />
α 33 0.0009 0.300 α 33 0.0005 0.210<br />
α 11 0.0014 0.190<br />
1950 α 22 0.0004 0.150<br />
α 33 0.0008 0.195<br />
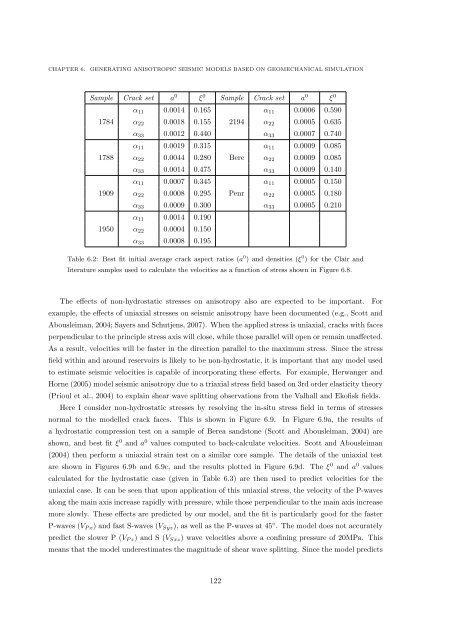
Table 6.2: Best fit initial average crack aspect ratios (a 0 ) <strong>and</strong> densities (ξ 0 ) for the Clair <strong>and</strong><br />
literature samples used to calculate the velocities as a function <strong>of</strong> stress shown in Figure 6.8.<br />
The effects <strong>of</strong> non-hydrostatic stresses on anisotropy also are expected to be important. For<br />
example, the effects <strong>of</strong> uniaxial stresses on seismic anisotropy have been documented (e.g., Scott <strong>and</strong><br />
Abousleiman, 2004; Sayers <strong>and</strong> Schutjens, 2007). When the applied stress is uniaxial, cracks with faces<br />
perpendicular to the principle stress axis will close, while those parallel will open or remain unaffected.<br />
As a result, velocities will be faster in the direction parallel to the maximum stress. Since the stress<br />
field within <strong>and</strong> around reservoirs is likely to be non-hydrostatic, it is important that any model used<br />
to estimate seismic velocities is capable <strong>of</strong> incorporating these effects. For example, Herwanger <strong>and</strong><br />
Horne (2005) model seismic anisotropy due to a triaxial stress field based on 3rd order elasticity theory<br />
(Prioul et al., 2004) to explain shear wave splitting observations from the Valhall <strong>and</strong> Ek<strong>of</strong>isk fields.<br />
Here I consider non-hydrostatic stresses by resolving the in-situ stress field in terms <strong>of</strong> stresses<br />
normal to the modelled crack faces. This is shown in Figure 6.9. In Figure 6.9a, the results <strong>of</strong><br />
a hydrostatic compression test on a sample <strong>of</strong> Berea s<strong>and</strong>stone (Scott <strong>and</strong> Abousleiman, 2004) are<br />
shown, <strong>and</strong> best fit ξ 0 <strong>and</strong> a 0 values computed to back-calculate velocities. Scott <strong>and</strong> Abousleiman<br />
(2004) then perform a uniaxial strain test on a similar core sample. The details <strong>of</strong> the uniaxial test<br />
are shown in Figures 6.9b <strong>and</strong> 6.9c, <strong>and</strong> the results plotted in Figure 6.9d. The ξ 0 <strong>and</strong> a 0 values<br />
calculated for the hydrostatic case (given in Table 6.3) are then used to predict velocities for the<br />
uniaxial case. It can be seen that upon application <strong>of</strong> this uniaxial stress, the velocity <strong>of</strong> the P-waves<br />
along the main axis increase rapidly with pressure, while those perpendicular to the main axis increase<br />
more slowly. These effects are predicted by our model, <strong>and</strong> the fit is particularly good for the faster<br />
P-waves (V P x ) <strong>and</strong> fast S-waves (V Syz ), as well as the P-waves at 45 ◦ . The model does not accurately<br />
predict the slower P (V P z ) <strong>and</strong> S (V Sxz ) wave velocities above a confining pressure <strong>of</strong> 20MPa. This<br />
means that the model underestimates the magnitude <strong>of</strong> shear wave splitting. Since the model predicts<br />
122


