

Microseismic Monitoring and Geomechanical Modelling of CO2 - bris
Microseismic Monitoring and Geomechanical Modelling of CO2 - bris
Microseismic Monitoring and Geomechanical Modelling of CO2 - bris

You also want an ePaper? Increase the reach of your titles
YUMPU automatically turns print PDFs into web optimized ePapers that Google loves.
CHAPTER 8.<br />
LINKING GEOMECHANICAL MODELLING AND MICROSEISMIC OBSERVATIONS AT WEYBURN<br />
Unit χ ϕ f<br />
Caprock 5 (18.5) MPa 45 ◦<br />
Reservoir 3.5 MPa 40 ◦<br />
Table 8.4: Yield envelope parameters for the Weyburn model. A lower value than that measured<br />
on core samples is used for the cohesion <strong>of</strong> the caprock, which is given in brackets.<br />
3 months <strong>of</strong> injection (timestep 12) <strong>and</strong> after 1 year <strong>of</strong> injection (timestep 16), both in the reservoir<br />
(Figure 8.7) <strong>and</strong> in the overburden (Figure 8.8). From these figures I note that fracture potential<br />
increases in the reservoir during production, while it is relatively unchanged in the overburden. Once<br />
injection begins, there is a sharp increase in fracture potential in the overburden above the injection<br />
wells, while there is a drop in fracture potential in the reservoir at the injection well. The fracture<br />
potentials at the producing wells are relatively unchanged during injection.<br />
In general, there are some qualitative comparisons that can be made between this model <strong>and</strong><br />
the observations made at Weyburn. For instance, the fact that across most <strong>of</strong> the reservoir fracture<br />
potential is not increased by injection matches with the lack <strong>of</strong> seismicity recorded. Also, this model<br />
suggests that fracture potential should be higher at the production wells than at the injection wells,<br />
which matches the observations that the majority <strong>of</strong> events occur close to the producers. However,<br />
this model can not explain why so many events are located in the overburden above the producing<br />
wells, while the models predict that there should be microseismicity above the injection well, where<br />
none is observed. The suitability <strong>of</strong> this model can also be assessed through a comparison <strong>of</strong> the<br />
seismic anisotropy that it predicts.<br />
2000<br />
17<br />
2000<br />
18<br />
1500<br />
16<br />
1500<br />
17.8<br />
15<br />
17.6<br />
Y<br />
1000<br />
Y<br />
1000<br />
14<br />
17.4<br />
500<br />
13<br />
500<br />
17.2<br />
0<br />
1500 2000 2500 3000<br />
X<br />
12<br />
0<br />
1500 2000 2500 3000<br />
X<br />
17<br />
(a)<br />
(b)<br />
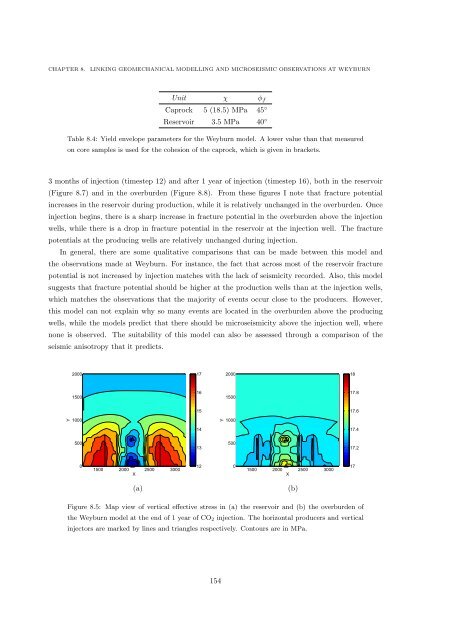
Figure 8.5: Map view <strong>of</strong> vertical effective stress in (a) the reservoir <strong>and</strong> (b) the overburden <strong>of</strong><br />
the Weyburn model at the end <strong>of</strong> 1 year <strong>of</strong> CO 2 injection. The horizontal producers <strong>and</strong> vertical<br />
injectors are marked by lines <strong>and</strong> triangles respectively. Contours are in MPa.<br />
154


