

Microseismic Monitoring and Geomechanical Modelling of CO2 - bris
Microseismic Monitoring and Geomechanical Modelling of CO2 - bris
Microseismic Monitoring and Geomechanical Modelling of CO2 - bris

You also want an ePaper? Increase the reach of your titles
YUMPU automatically turns print PDFs into web optimized ePapers that Google loves.
6.3. A MICRO-STRUCTURAL MODEL FOR NONLINEAR ELASTICITY<br />
5000<br />
1784<br />
4000<br />
1788<br />
4500<br />
1909<br />
5500<br />
1950<br />
4500<br />
3500<br />
4000<br />
5000<br />
Velocity (m/s)<br />
4000<br />
3500<br />
3000<br />
Velocity (m/s)<br />
3000<br />
2500<br />
Velocity (m/s)<br />
3500<br />
3000<br />
Velocity (m/s)<br />
4500<br />
4000<br />
3500<br />
3000<br />
2500<br />
2000<br />
2500<br />
2500<br />
2000<br />
0 20 40<br />
Pressure (MPa)<br />
1500<br />
0 20 40<br />
Pressure (MPa)<br />
2000<br />
0 20 40<br />
Pressure (MPa)<br />
2000<br />
0 20 40<br />
Pressure (MPa)<br />
4500<br />
2194<br />
4200<br />
Bere<br />
4500<br />
Penr<br />
4000<br />
4000<br />
3800<br />
4000<br />
3500<br />
3600<br />
Velocity (m/s)<br />
3000<br />
2500<br />
Velocity (m/s)<br />
3400<br />
3200<br />
3000<br />
2800<br />
Velocity (m/s)<br />
3500<br />
3000<br />
2000<br />
2600<br />
2500<br />
2400<br />
1500<br />
0 20 40<br />
Pressure (MPa)<br />
2200<br />
0 50 100<br />
Pressure (MPa)<br />
2000<br />
0 20 40 60<br />
Pressure (MPa)<br />
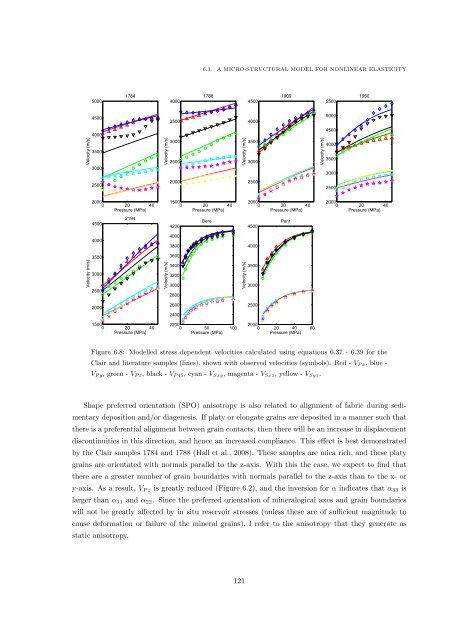
Figure 6.8: Modelled stress dependent velocities calculated using equations 6.37 - 6.39 for the<br />
Clair <strong>and</strong> literature samples (lines), shown with observed velocities (symbols). Red - V P x, blue -<br />
V P y , green - V P z , black - V P 45 , cyan - V Sxy , magenta - V Sxz , yellow - V Syz .<br />
Shape preferred orientation (SPO) anisotropy is also related to alignment <strong>of</strong> fabric during sedimentary<br />
deposition <strong>and</strong>/or diagenesis. If platy or elongate grains are deposited in a manner such that<br />
there is a preferential alignment between grain contacts, then there will be an increase in displacement<br />
discontinuities in this direction, <strong>and</strong> hence an increased compliance. This effect is best demonstrated<br />
by the Clair samples 1784 <strong>and</strong> 1788 (Hall et al., 2008). These samples are mica rich, <strong>and</strong> these platy<br />
grains are orientated with normals parallel to the z-axis. With this the case, we expect to find that<br />
there are a greater number <strong>of</strong> grain boundaries with normals parallel to the z-axis than to the x- or<br />
y-axis. As a result, V P z is greatly reduced (Figure 6.2), <strong>and</strong> the inversion for α indicates that α 33 is<br />
larger than α 11 <strong>and</strong> α 22 . Since the preferred orientation <strong>of</strong> mineralogical axes <strong>and</strong> grain boundaries<br />
will not be greatly affected by in situ reservoir stresses (unless these are <strong>of</strong> sufficient magnitude to<br />
cause deformation or failure <strong>of</strong> the mineral grains), I refer to the anisotropy that they generate as<br />
static anisotropy.<br />
121


