

Microseismic Monitoring and Geomechanical Modelling of CO2 - bris
Microseismic Monitoring and Geomechanical Modelling of CO2 - bris
Microseismic Monitoring and Geomechanical Modelling of CO2 - bris

You also want an ePaper? Increase the reach of your titles
YUMPU automatically turns print PDFs into web optimized ePapers that Google loves.
6.4. CALIBRATION WITH LITERATURE DATA<br />
Sample ϕ κ (mD) qtz fspr calc phyl kaol ξ 0 a 0<br />
1784 12.0 24.0 38.64 18.26 18.26 6.20 6.65 0.25 0.0015<br />
1788 8.0 0.02 30.89 25.41 1.32 34.38 0.00 0.36 0.0026<br />
1909 13.0 2.8 54.95 16.07 10.48 3.73 1.78 0.31 0.0008<br />
1950 14.8 84.00 44.19 30.46 7.45 3.10 0.00 0.18 0.0009<br />
2194 12.1 1.40 61.05 12.62 8.06 1.70 4.48 0.66 0.0006<br />
Table 6.7: Physical properties <strong>of</strong> the Clair samples showing the % mineral constituents<br />
(qtz=quartz, fspr=feldspar, calc=calcite, phyl=phyllosilicates <strong>and</strong> kaol=kaolinite).<br />
(a)<br />
(b)<br />
(c)<br />
(d)<br />
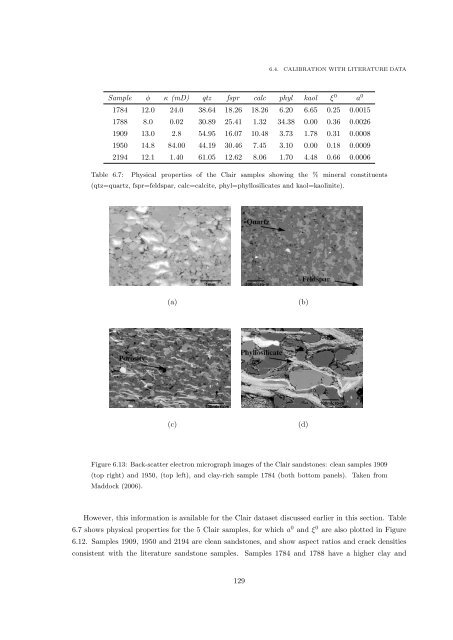
Figure 6.13: Back-scatter electron micrograph images <strong>of</strong> the Clair s<strong>and</strong>stones: clean samples 1909<br />
(top right) <strong>and</strong> 1950, (top left), <strong>and</strong> clay-rich sample 1784 (both bottom panels). Taken from<br />
Maddock (2006).<br />
However, this information is available for the Clair dataset discussed earlier in this section. Table<br />
6.7 shows physical properties for the 5 Clair samples, for which a 0 <strong>and</strong> ξ 0 are also plotted in Figure<br />
6.12. Samples 1909, 1950 <strong>and</strong> 2194 are clean s<strong>and</strong>stones, <strong>and</strong> show aspect ratios <strong>and</strong> crack densities<br />
consistent with the literature s<strong>and</strong>stone samples. Samples 1784 <strong>and</strong> 1788 have a higher clay <strong>and</strong><br />
129


