

Microseismic Monitoring and Geomechanical Modelling of CO2 - bris
Microseismic Monitoring and Geomechanical Modelling of CO2 - bris
Microseismic Monitoring and Geomechanical Modelling of CO2 - bris

You also want an ePaper? Increase the reach of your titles
YUMPU automatically turns print PDFs into web optimized ePapers that Google loves.
CHAPTER 4. A COMPARISON OF MICROSEISMIC MONITORING OF FRACTURE STIMULATION DUE TO WATER<br />
VERSUS CO 2 INJECTION<br />
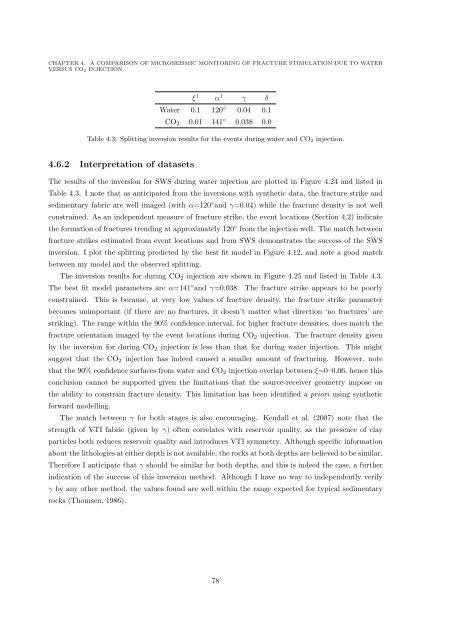
ξ 1 α 1 γ δ<br />
Water 0.1 120 ◦ 0.04 0.1<br />
CO 2 0.01 141 ◦ 0.038 0.0<br />
Table 4.3: Splitting inversion results for the events during water <strong>and</strong> CO 2 injection.<br />
4.6.2 Interpretation <strong>of</strong> datasets<br />
The results <strong>of</strong> the inversion for SWS during water injection are plotted in Figure 4.24 <strong>and</strong> listed in<br />
Table 4.3. I note that as anticipated from the inversions with synthetic data, the fracture strike <strong>and</strong><br />
sedimentary fabric are well imaged (with α=120 ◦ <strong>and</strong> γ=0.04) while the fracture density is not well<br />
constrained. As an independent measure <strong>of</strong> fracture strike, the event locations (Section 4.2) indicate<br />
the formation <strong>of</strong> fractures trending at approximately 120 ◦ from the injection well. The match between<br />
fracture strikes estimated from event locations <strong>and</strong> from SWS demonstrates the success <strong>of</strong> the SWS<br />
inversion. I plot the splitting predicted by the best fit model in Figure 4.12, <strong>and</strong> note a good match<br />
between my model <strong>and</strong> the observed splitting.<br />
The inversion results for during CO 2 injection are shown in Figure 4.25 <strong>and</strong> listed in Table 4.3.<br />
The best fit model parameters are α=141 ◦ <strong>and</strong> γ=0.038. The fracture strike appears to be poorly<br />
constrained. This is because, at very low values <strong>of</strong> fracture density, the fracture strike parameter<br />
becomes unimportant (if there are no fractures, it doesn’t matter what direction ‘no fractures’ are<br />
striking). The range within the 90% confidence interval, for higher fracture densities, does match the<br />
fracture orientation imaged by the event locations during CO 2 injection. The fracture density given<br />
by the inversion for during CO 2 injection is less than that for during water injection. This might<br />
suggest that the CO 2 injection has indeed caused a smaller amount <strong>of</strong> fracturing. However, note<br />
that the 90% confidence surfaces from water <strong>and</strong> CO 2 injection overlap between ξ∼0–0.06, hence this<br />
conclusion cannot be supported given the limitations that the source-receiver geometry impose on<br />
the ability to constrain fracture density. This limitation has been identified a priori using synthetic<br />
forward modelling.<br />
The match between γ for both stages is also encouraging. Kendall et al. (2007) note that the<br />
strength <strong>of</strong> VTI fabric (given by γ) <strong>of</strong>ten correlates with reservoir quality, as the presence <strong>of</strong> clay<br />
particles both reduces reservoir quality <strong>and</strong> introduces VTI symmetry. Although specific information<br />
about the lithologies at either depth is not available, the rocks at both depths are believed to be similar.<br />
Therefore I anticipate that γ should be similar for both depths, <strong>and</strong> this is indeed the case, a further<br />
indication <strong>of</strong> the success <strong>of</strong> this inversion method. Although I have no way to independently verify<br />
γ by any other method, the values found are well within the range expected for typical sedimentary<br />
rocks (Thomsen, 1986).<br />
78


