

Microseismic Monitoring and Geomechanical Modelling of CO2 - bris
Microseismic Monitoring and Geomechanical Modelling of CO2 - bris
Microseismic Monitoring and Geomechanical Modelling of CO2 - bris

Create successful ePaper yourself
Turn your PDF publications into a flip-book with our unique Google optimized e-Paper software.
CHAPTER 4. A COMPARISON OF MICROSEISMIC MONITORING OF FRACTURE STIMULATION DUE TO WATER<br />
VERSUS CO 2 INJECTION<br />
Depth (m)<br />
2800<br />
2820<br />
2840<br />
2860<br />
2880<br />
2900<br />
2920<br />
0 2 4 6 8 10<br />
(a)<br />
Depth (m)<br />
2540<br />
2560<br />
2580<br />
2600<br />
2620<br />
2640<br />
2660<br />
0 2 4 6 8 10<br />
(b)<br />
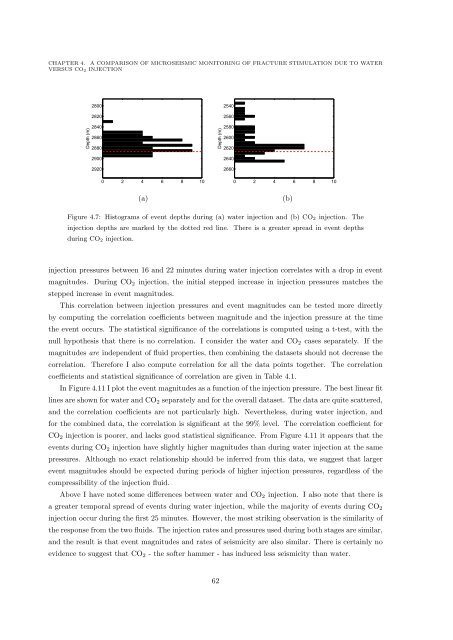
Figure 4.7: Histograms <strong>of</strong> event depths during (a) water injection <strong>and</strong> (b) CO 2 injection. The<br />
injection depths are marked by the dotted red line. There is a greater spread in event depths<br />
during CO 2 injection.<br />
injection pressures between 16 <strong>and</strong> 22 minutes during water injection correlates with a drop in event<br />
magnitudes. During CO 2 injection, the initial stepped increase in injection pressures matches the<br />
stepped increase in event magnitudes.<br />
This correlation between injection pressures <strong>and</strong> event magnitudes can be tested more directly<br />
by computing the correlation coefficients between magnitude <strong>and</strong> the injection pressure at the time<br />
the event occurs. The statistical significance <strong>of</strong> the correlations is computed using a t-test, with the<br />
null hypothesis that there is no correlation. I consider the water <strong>and</strong> CO 2 cases separately. If the<br />
magnitudes are independent <strong>of</strong> fluid properties, then combining the datasets should not decrease the<br />
correlation. Therefore I also compute correlation for all the data points together. The correlation<br />
coefficients <strong>and</strong> statistical significance <strong>of</strong> correlation are given in Table 4.1.<br />
In Figure 4.11 I plot the event magnitudes as a function <strong>of</strong> the injection pressure. The best linear fit<br />
lines are shown for water <strong>and</strong> CO 2 separately <strong>and</strong> for the overall dataset. The data are quite scattered,<br />
<strong>and</strong> the correlation coefficients are not particularly high. Nevertheless, during water injection, <strong>and</strong><br />
for the combined data, the correlation is significant at the 99% level. The correlation coefficient for<br />
CO 2 injection is poorer, <strong>and</strong> lacks good statistical significance. From Figure 4.11 it appears that the<br />
events during CO 2 injection have slightly higher magnitudes than during water injection at the same<br />
pressures. Although no exact relationship should be inferred from this data, we suggest that larger<br />
event magnitudes should be expected during periods <strong>of</strong> higher injection pressures, regardless <strong>of</strong> the<br />
compressibility <strong>of</strong> the injection fluid.<br />
Above I have noted some differences between water <strong>and</strong> CO 2 injection. I also note that there is<br />
a greater temporal spread <strong>of</strong> events during water injection, while the majority <strong>of</strong> events during CO 2<br />
injection occur during the first 25 minutes. However, the most striking observation is the similarity <strong>of</strong><br />
the response from the two fluids. The injection rates <strong>and</strong> pressures used during both stages are similar,<br />
<strong>and</strong> the result is that event magnitudes <strong>and</strong> rates <strong>of</strong> seismicity are also similar. There is certainly no<br />
evidence to suggest that CO 2 - the s<strong>of</strong>ter hammer - has induced less seismicity than water.<br />
62


