

Microseismic Monitoring and Geomechanical Modelling of CO2 - bris
Microseismic Monitoring and Geomechanical Modelling of CO2 - bris
Microseismic Monitoring and Geomechanical Modelling of CO2 - bris

Create successful ePaper yourself
Turn your PDF publications into a flip-book with our unique Google optimized e-Paper software.
CHAPTER 4. A COMPARISON OF MICROSEISMIC MONITORING OF FRACTURE STIMULATION DUE TO WATER<br />
VERSUS CO 2 INJECTION<br />
Pressure (MPa)<br />
Number <strong>of</strong> Events<br />
50<br />
40<br />
30<br />
20<br />
10<br />
Pressure<br />
Flow rate<br />
10<br />
0<br />
0 20 40 60 80 100 120 0<br />
15<br />
10<br />
5<br />
0<br />
0 20 40 60 80 100 120<br />
Time (minutes)<br />
40<br />
30<br />
20<br />
Flow rate (bpm)<br />
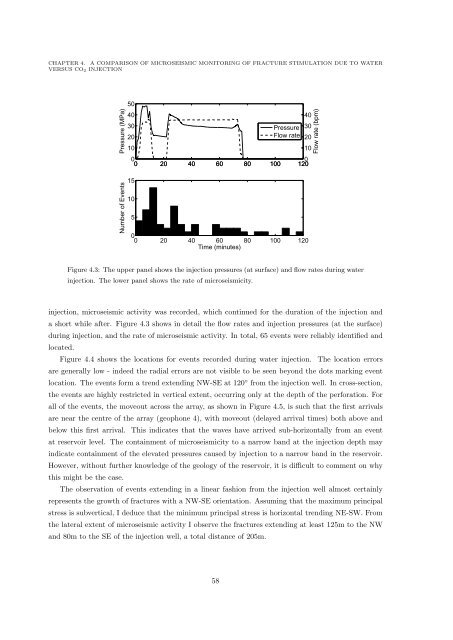
Figure 4.3: The upper panel shows the injection pressures (at surface) <strong>and</strong> flow rates during water<br />
injection. The lower panel shows the rate <strong>of</strong> microseismicity.<br />
injection, microseismic activity was recorded, which continued for the duration <strong>of</strong> the injection <strong>and</strong><br />
a short while after. Figure 4.3 shows in detail the flow rates <strong>and</strong> injection pressures (at the surface)<br />
during injection, <strong>and</strong> the rate <strong>of</strong> microseismic activity. In total, 65 events were reliably identified <strong>and</strong><br />
located.<br />
Figure 4.4 shows the locations for events recorded during water injection. The location errors<br />
are generally low - indeed the radial errors are not visible to be seen beyond the dots marking event<br />
location. The events form a trend extending NW-SE at 120 ◦ from the injection well. In cross-section,<br />
the events are highly restricted in vertical extent, occurring only at the depth <strong>of</strong> the perforation. For<br />
all <strong>of</strong> the events, the moveout across the array, as shown in Figure 4.5, is such that the first arrivals<br />
are near the centre <strong>of</strong> the array (geophone 4), with moveout (delayed arrival times) both above <strong>and</strong><br />
below this first arrival. This indicates that the waves have arrived sub-horizontally from an event<br />
at reservoir level. The containment <strong>of</strong> microseismicity to a narrow b<strong>and</strong> at the injection depth may<br />
indicate containment <strong>of</strong> the elevated pressures caused by injection to a narrow b<strong>and</strong> in the reservoir.<br />
However, without further knowledge <strong>of</strong> the geology <strong>of</strong> the reservoir, it is difficult to comment on why<br />
this might be the case.<br />
The observation <strong>of</strong> events extending in a linear fashion from the injection well almost certainly<br />
represents the growth <strong>of</strong> fractures with a NW-SE orientation. Assuming that the maximum principal<br />
stress is subvertical, I deduce that the minimum principal stress is horizontal trending NE-SW. From<br />
the lateral extent <strong>of</strong> microseismic activity I observe the fractures extending at least 125m to the NW<br />
<strong>and</strong> 80m to the SE <strong>of</strong> the injection well, a total distance <strong>of</strong> 205m.<br />
58


