

Microseismic Monitoring and Geomechanical Modelling of CO2 - bris
Microseismic Monitoring and Geomechanical Modelling of CO2 - bris
Microseismic Monitoring and Geomechanical Modelling of CO2 - bris

Create successful ePaper yourself
Turn your PDF publications into a flip-book with our unique Google optimized e-Paper software.
CHAPTER 2.<br />
THE WEYBURN CO 2 INJECTION PROJECT<br />
3<br />
Oil Production rate (m )<br />
Date<br />
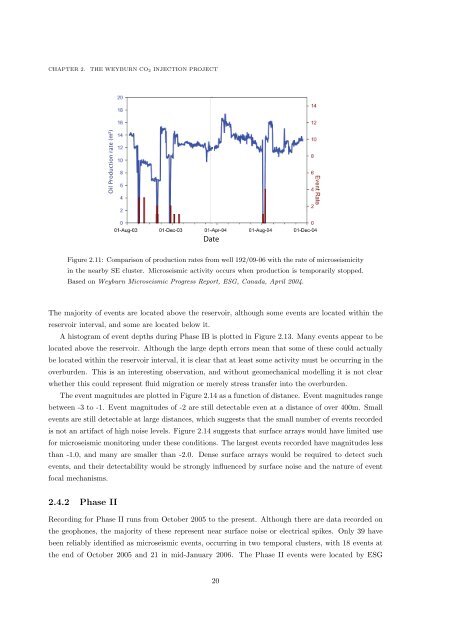
Figure 2.11: Comparison <strong>of</strong> production rates from well 192/09-06 with the rate <strong>of</strong> microseismicity<br />
in the nearby SE cluster. <strong>Microseismic</strong> activity occurs when production is temporarily stopped.<br />
Based on Weyburn <strong>Microseismic</strong> Progress Report, ESG, Canada, April 2004.<br />
The majority <strong>of</strong> events are located above the reservoir, although some events are located within the<br />
reservoir interval, <strong>and</strong> some are located below it.<br />
A histogram <strong>of</strong> event depths during Phase IB is plotted in Figure 2.13. Many events appear to be<br />
located above the reservoir. Although the large depth errors mean that some <strong>of</strong> these could actually<br />
be located within the reservoir interval, it is clear that at least some activity must be occurring in the<br />
overburden. This is an interesting observation, <strong>and</strong> without geomechanical modelling it is not clear<br />
whether this could represent fluid migration or merely stress transfer into the overburden.<br />
The event magnitudes are plotted in Figure 2.14 as a function <strong>of</strong> distance. Event magnitudes range<br />
between -3 to -1. Event magnitudes <strong>of</strong> -2 are still detectable even at a distance <strong>of</strong> over 400m. Small<br />
events are still detectable at large distances, which suggests that the small number <strong>of</strong> events recorded<br />
is not an artifact <strong>of</strong> high noise levels. Figure 2.14 suggests that surface arrays would have limited use<br />
for microseismic monitoring under these conditions. The largest events recorded have magnitudes less<br />
than -1.0, <strong>and</strong> many are smaller than -2.0. Dense surface arrays would be required to detect such<br />
events, <strong>and</strong> their detectability would be strongly influenced by surface noise <strong>and</strong> the nature <strong>of</strong> event<br />
focal mechanisms.<br />
2.4.2 Phase II<br />
Recording for Phase II runs from October 2005 to the present. Although there are data recorded on<br />
the geophones, the majority <strong>of</strong> these represent near surface noise or electrical spikes. Only 39 have<br />
been reliably identified as microseismic events, occurring in two temporal clusters, with 18 events at<br />
the end <strong>of</strong> October 2005 <strong>and</strong> 21 in mid-January 2006. The Phase II events were located by ESG<br />
20


