

Microseismic Monitoring and Geomechanical Modelling of CO2 - bris
Microseismic Monitoring and Geomechanical Modelling of CO2 - bris
Microseismic Monitoring and Geomechanical Modelling of CO2 - bris

Create successful ePaper yourself
Turn your PDF publications into a flip-book with our unique Google optimized e-Paper software.
4.3. EVENT MAGNITUDES<br />
Pressure (MPa)<br />
Number <strong>of</strong> Events<br />
50<br />
40<br />
30<br />
20<br />
20<br />
10<br />
Pressure<br />
10<br />
Flow rate<br />
0<br />
0 20 40 60 80 0<br />
15<br />
10<br />
5<br />
0<br />
0 20 40 60 80<br />
Time (minutes)<br />
50<br />
40<br />
30<br />
Flow rate (bpm)<br />
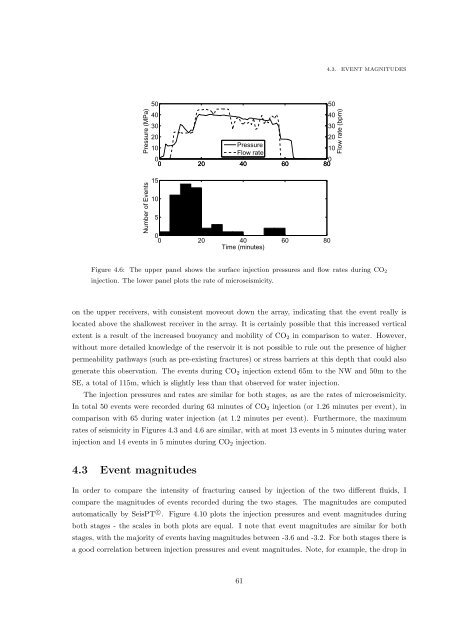
Figure 4.6: The upper panel shows the surface injection pressures <strong>and</strong> flow rates during CO 2<br />
injection. The lower panel plots the rate <strong>of</strong> microseismicity.<br />
on the upper receivers, with consistent moveout down the array, indicating that the event really is<br />
located above the shallowest receiver in the array. It is certainly possible that this increased vertical<br />
extent is a result <strong>of</strong> the increased buoyancy <strong>and</strong> mobility <strong>of</strong> CO 2 in comparison to water. However,<br />
without more detailed knowledge <strong>of</strong> the reservoir it is not possible to rule out the presence <strong>of</strong> higher<br />
permeability pathways (such as pre-existing fractures) or stress barriers at this depth that could also<br />
generate this observation. The events during CO 2 injection extend 65m to the NW <strong>and</strong> 50m to the<br />
SE, a total <strong>of</strong> 115m, which is slightly less than that observed for water injection.<br />
The injection pressures <strong>and</strong> rates are similar for both stages, as are the rates <strong>of</strong> microseismicity.<br />
In total 50 events were recorded during 63 minutes <strong>of</strong> CO 2 injection (or 1.26 minutes per event), in<br />
comparison with 65 during water injection (at 1.2 minutes per event). Furthermore, the maximum<br />
rates <strong>of</strong> seismicity in Figures 4.3 <strong>and</strong> 4.6 are similar, with at most 13 events in 5 minutes during water<br />
injection <strong>and</strong> 14 events in 5 minutes during CO 2 injection.<br />
4.3 Event magnitudes<br />
In order to compare the intensity <strong>of</strong> fracturing caused by injection <strong>of</strong> the two different fluids, I<br />
compare the magnitudes <strong>of</strong> events recorded during the two stages. The magnitudes are computed<br />
automatically by SeisPT c⃝ . Figure 4.10 plots the injection pressures <strong>and</strong> event magnitudes during<br />
both stages - the scales in both plots are equal. I note that event magnitudes are similar for both<br />
stages, with the majority <strong>of</strong> events having magnitudes between -3.6 <strong>and</strong> -3.2. For both stages there is<br />
a good correlation between injection pressures <strong>and</strong> event magnitudes. Note, for example, the drop in<br />
61


