

Microseismic Monitoring and Geomechanical Modelling of CO2 - bris
Microseismic Monitoring and Geomechanical Modelling of CO2 - bris
Microseismic Monitoring and Geomechanical Modelling of CO2 - bris

You also want an ePaper? Increase the reach of your titles
YUMPU automatically turns print PDFs into web optimized ePapers that Google loves.
CHAPTER 2.<br />
THE WEYBURN CO 2 INJECTION PROJECT<br />
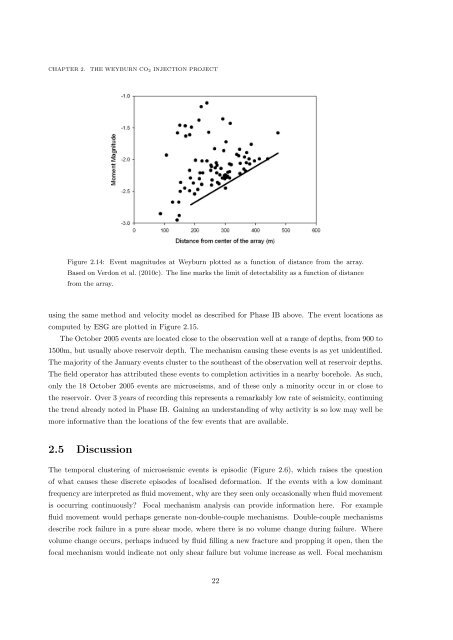
Figure 2.14: Event magnitudes at Weyburn plotted as a function <strong>of</strong> distance from the array.<br />
Based on Verdon et al. (2010c). The line marks the limit <strong>of</strong> detectability as a function <strong>of</strong> distance<br />
from the array.<br />
using the same method <strong>and</strong> velocity model as described for Phase IB above. The event locations as<br />
computed by ESG are plotted in Figure 2.15.<br />
The October 2005 events are located close to the observation well at a range <strong>of</strong> depths, from 900 to<br />
1500m, but usually above reservoir depth. The mechanism causing these events is as yet unidentified.<br />
The majority <strong>of</strong> the January events cluster to the southeast <strong>of</strong> the observation well at reservoir depths.<br />
The field operator has attributed these events to completion activities in a nearby borehole. As such,<br />
only the 18 October 2005 events are microseisms, <strong>and</strong> <strong>of</strong> these only a minority occur in or close to<br />
the reservoir. Over 3 years <strong>of</strong> recording this represents a remarkably low rate <strong>of</strong> seismicity, continuing<br />
the trend already noted in Phase IB. Gaining an underst<strong>and</strong>ing <strong>of</strong> why activity is so low may well be<br />
more informative than the locations <strong>of</strong> the few events that are available.<br />
2.5 Discussion<br />
The temporal clustering <strong>of</strong> microseismic events is episodic (Figure 2.6), which raises the question<br />
<strong>of</strong> what causes these discrete episodes <strong>of</strong> localised deformation. If the events with a low dominant<br />
frequency are interpreted as fluid movement, why are they seen only occasionally when fluid movement<br />
is occurring continuously Focal mechanism analysis can provide information here. For example<br />
fluid movement would perhaps generate non-double-couple mechanisms. Double-couple mechanisms<br />
describe rock failure in a pure shear mode, where there is no volume change during failure. Where<br />
volume change occurs, perhaps induced by fluid filling a new fracture <strong>and</strong> propping it open, then the<br />
focal mechanism would indicate not only shear failure but volume increase as well. Focal mechanism<br />
22


