- Page 4 and 5:
Contents FOREWORD (Jan Burnewicz)..
- Page 6 and 7:
9.4. Security of information.......
- Page 8 and 9:
20.3. Factors stimulating the devel
- Page 10 and 11:
great and has brought measurable ef
- Page 12 and 13:
The theory of innovation was introd
- Page 14 and 15:
According to Robert U. Ayres, who p
- Page 16 and 17:
tions may be of technological, orga
- Page 18 and 19:
1.2. Innovation features Innovation
- Page 20 and 21:
The sources of innovation embrace a
- Page 22 and 23:
Table 2. Innovation processes model
- Page 24 and 25:
of techniques. Strategic integratio
- Page 26 and 27:
32. Sudo³ S., Przedsiêbiorstwo pr
- Page 28 and 29:
land, attempts were made in the ear
- Page 30 and 31:
English 9 . As can be seen, the phr
- Page 32 and 33:
The European Union, being an area o
- Page 34 and 35:
tives of member states and associat
- Page 36 and 37:
- a direct result of research which
- Page 38 and 39:
is, in particular, the response to
- Page 40 and 41:
2.6. Bibliography 1. Blaug M., Teor
- Page 42 and 43:
stems from the economic policy 3 ,
- Page 44 and 45:
according to the linear innovation
- Page 46 and 47:
- the shaping and consolidation of
- Page 48 and 49:
Treaty of Amsterdam (“Research an
- Page 50 and 51:
Unfortunately, the first period of
- Page 52 and 53:
and technical subjects in several a
- Page 54 and 55:
Fig. 5), where growing competitiven
- Page 56 and 57:
Table 8. Innovation performance of
- Page 58 and 59:
0,700 0,600 0,500 0,400 0,300 0,200
- Page 60 and 61:
3.3. Polish innovation policy In Po
- Page 62 and 63:
lopment in the future, e.g. Turkey,
- Page 64 and 65:
1989 1990 1991 1992 1993 1994 1995
- Page 66 and 67:
- 6.4 billion euro to be provided b
- Page 68 and 69:
knowledge-based economy is the only
- Page 70 and 71:
- arising during business activity,
- Page 72 and 73:
- the use of advanced methods and t
- Page 74 and 75:
Chapter 4 A STUDY OF INNOVATIVE TRE
- Page 76 and 77:
In more recent centuries, though, t
- Page 78 and 79:
economic development. In this diagn
- Page 80 and 81:
placing private car use with public
- Page 82 and 83:
The prime module of modern transpor
- Page 84 and 85:
cialisation. 33 What this notion ac
- Page 86 and 87:
era in technology, but had no comme
- Page 88 and 89:
ecome a matter of honour for major
- Page 90 and 91:
Fig. 14. A Toyota FT-EV at Detroit
- Page 92 and 93:
Fuel Cell Vehicles - FCV) 75 are a
- Page 94 and 95:
94 - Toyota FCHV 81 is another of T
- Page 96 and 97:
- Daimler Mercedes-Benz Citaro fuel
- Page 98 and 99:
ange. The popularity of hybrid pass
- Page 100 and 101:
X2000 116 , the Finnish S220 117 ,
- Page 102 and 103:
•Commercial Turboprop Service •
- Page 105 and 106:
dards 138 . Intense activity can al
- Page 107 and 108:
- new technologies of winter inland
- Page 109 and 110:
Fig.18.Vélib-abicycle rental syste
- Page 111 and 112:
tional and EU authorities as well a
- Page 113 and 114:
National Highway Research Laborator
- Page 115 and 116:
innovation in terms of rail shape a
- Page 117 and 118:
Infrastructural innovations aim at
- Page 119 and 120:
14. Konings R., ThijsR., Foldable C
- Page 121 and 122:
tainable competitive advantage in t
- Page 123 and 124:
ten years. Technological innovation
- Page 125 and 126:
ticians, researchers and practition
- Page 127 and 128:
show that it is the time of respons
- Page 129 and 130:
gies were gaining more importance i
- Page 131 and 132:
chain at a strategic level and focu
- Page 133 and 134:
sary for company management and for
- Page 135 and 136:
- Electronic Data Interchange (EDI)
- Page 137 and 138:
effective solution of logistic task
- Page 139 and 140:
- thermostat warehouse. Automation
- Page 141 and 142:
assess the productivity of the rend
- Page 143 and 144:
15. Follow the leaders. Scoring hig
- Page 145 and 146:
Chapter 6 NEW-GENERATION TRANSPORT
- Page 147 and 148:
1. The Panama Canal bridge 2. The B
- Page 149 and 150:
Among intercontinental crossings is
- Page 151 and 152:
Each human action has an effect on
- Page 153 and 154:
monious effect remains ingrained de
- Page 155 and 156:
Regrettably, the project was not co
- Page 157 and 158:
6.7. Bibliography 1. Brown D. J., M
- Page 159 and 160:
The purpose of this chapter is not
- Page 161 and 162:
7 8 9 10 11 12 Improving road safet
- Page 163 and 164:
Table 20. Satellite navigation in t
- Page 165 and 166:
predict a traffic jam on a specific
- Page 167 and 168:
of rail tracks, inspections and tes
- Page 169 and 170:
9. Roads. Galileo Application Sheet
- Page 171 and 172:
transport modes, infrastructure and
- Page 173 and 174:
- plan the routes and optimize park
- Page 175 and 176:
ies. In modern logistics systems, t
- Page 177 and 178:
Fig. 33. Option II of vehicle route
- Page 179 and 180:
Optimization of route selection dep
- Page 181 and 182:
Chapter 9 NEW INFORMATION TECHNOLOG
- Page 183 and 184:
uilding. The competitive advantage
- Page 185 and 186:
- systems for planning and optimiza
- Page 187 and 188:
and consist of defining information
- Page 189 and 190:
2. Naporowska E., Warunki rozwoju e
- Page 191 and 192:
10.2. Factors causing changes in ur
- Page 193 and 194:
10.3. Model description of modern u
- Page 195 and 196:
The French urban transport organiza
- Page 197 and 198:
petitiveness of urban transport wit
- Page 199 and 200:
a system of rewards and penalties b
- Page 201 and 202:
sales of tickets received on the ba
- Page 203 and 204:
Chapter 11 SUSTAINABLE URBAN MOBILI
- Page 205 and 206:
einstate the proper role of environ
- Page 207 and 208:
European cities had already been af
- Page 209 and 210:
limiting car use, especially in cit
- Page 211 and 212:
- support instruments for measures
- Page 213 and 214: City-wide Campaigns Innovative dema
- Page 215 and 216: ture, of consistent cycle-promoting
- Page 217 and 218: should be treated preferentially in
- Page 219 and 220: is that the bicycle is quite simply
- Page 221 and 222: Fig. 40. Comparison of various tran
- Page 223 and 224: struggle with inappropriate pavemen
- Page 225 and 226: Bicycle racks Other amenities They
- Page 227 and 228: Table 30. Comparison of percentage
- Page 229 and 230: 12.8. Bibliography 1. Cycling: the
- Page 231 and 232: and using nuclear, solar, water or
- Page 233 and 234: methods of performance enhancement
- Page 235 and 236: Table 31. Timeline of Euro standard
- Page 237 and 238: 10. Smalko Z., Sznytko J., Kierunki
- Page 239 and 240: Transport activity, a complementary
- Page 241 and 242: sis for making them more dynamic. I
- Page 243 and 244: The literature of the subject menti
- Page 245 and 246: specific nature of new markets and
- Page 247 and 248: In this context, the operation of T
- Page 249 and 250: Chapter 15 FACTORS INFLUENCING MODA
- Page 251 and 252: - to improve the understanding of u
- Page 253 and 254: The fiscal function of the charges
- Page 255 and 256: 15.3. Examples of How Differentiate
- Page 257 and 258: - increasing the accepted weight of
- Page 259 and 260: Still, from a technological viewpoi
- Page 261 and 262: At last, one notices that the natur
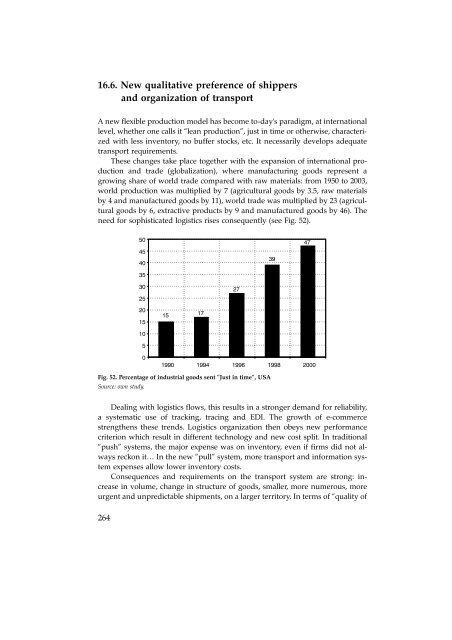
- Page 263: operation it results from, whereas
- Page 267 and 268: The importance of quality of servic
- Page 269 and 270: Chapter 17 TRENDS IN WORLD SHIPPING
- Page 271 and 272: 17.2. World seaborne trade and the
- Page 273 and 274: Table 37. World fleet size in the 1
- Page 275 and 276: day in 2011, compared with 83.3 mil
- Page 277 and 278: hicles at the end of 2005 to 168 ca
- Page 279 and 280: ate of BSR countries is higher than
- Page 281 and 282: In the BSR, as well as the entire E
- Page 283 and 284: 2005, the volume of cargo handled i
- Page 285 and 286: Among the trends of the EU transpor
- Page 287 and 288: enlarge loading capacity at minimum
- Page 289 and 290: 18.5. Port business diversification
- Page 291 and 292: 18.6. Relations with port cities, r
- Page 293 and 294: Chapter 19 MODERN ENVIRONMENTAL MAN
- Page 295 and 296: Green Paper on the Impact of Transp
- Page 297 and 298: - new tasks have appeared in connec
- Page 299 and 300: this area resulted in the Greening
- Page 301 and 302: activities aimed at separating dema
- Page 303 and 304: It is also worth noting that energy
- Page 305 and 306: Table 41. The most likely growth sc
- Page 307 and 308: Table 42. Towards sustainable trans
- Page 309 and 310: such. The use of the existing infra
- Page 311 and 312: Chapter 20 DEVELOPEMNT OF INTERNATI
- Page 313 and 314: tional logistics strengthened, and
- Page 315 and 316:
Paradoxically, we can say that the
- Page 317 and 318:
their financial resources (by 2008)
- Page 319 and 320:
At present, there are 15 Euroregion
- Page 321 and 322:
4) international financial relation
- Page 323 and 324:
Where: F= number of trips between t
- Page 325 and 326:
6. Logistyka w internacjonalizacjio
- Page 327 and 328:
prastructure and logistics services
- Page 329 and 330:
In the 1980s, more factors appeared
- Page 331 and 332:
which plans to cover the whole coun
- Page 333 and 334:
and Eastern Europe, it is only a lo
- Page 335 and 336:
to open for market economy. It led
- Page 337 and 338:
used and where the full range of co
- Page 339 and 340:
of intralogistics (see Fig. 68). Th
- Page 341 and 342:
sulting in the creation of new of s
- Page 343 and 344:
changes refers mainly to these sect
- Page 345 and 346:
costs. Because of the “bypassing
- Page 347 and 348:
5. Bogaschewsky R., Globale Beschaf
- Page 349 and 350:
this theory, a natural course of de
- Page 351 and 352:
On the other hand, the company’s
- Page 353 and 354:
a basis, particularly the evaluatio
- Page 355 and 356:
The ‘list of risks’ method cons
- Page 357 and 358:
the success of this risk descriptio
- Page 359 and 360:
It must be stressed that what is at
- Page 361 and 362:
Partial formalization in the proces
- Page 363 and 364:
etween those types of investments c
- Page 365 and 366:
other sectors of the economy. Such
- Page 367 and 368:
Comparative analysis of innovative
- Page 369 and 370:
on presenting periodical payment in
- Page 371 and 372:
time) of a new solution that has no
- Page 373 and 374:
12. Pietrzyka B., Klasyfikacja prze
- Page 375 and 376:
activities more attractive (quads 1
- Page 377 and 378:
interdisciplinary, although individ
- Page 379 and 380:
tem and modal deficiencies of conte
- Page 381 and 382:
Hydrogen propulsion is becoming ano
- Page 383 and 384:
can be regarded as the most importa
- Page 385 and 386:
lift-sharing, also called car-pooli
- Page 387 and 388:
A large group of technologies, give
- Page 389 and 390:
Every human activity has an impact
- Page 391 and 392:
The most useful function of road ca
- Page 393 and 394:
a growing number of inhabitants liv
- Page 395 and 396:
nation-wide promotional campaigns a
- Page 397 and 398:
As for innovations aimed at using a
- Page 399 and 400:
of freight on a given route, shapin
- Page 401 and 402:
and development of ports as land-se
- Page 403 and 404:
of economy: they are high in consum
- Page 405 and 406:
than potential profits the innovati
- Page 407 and 408:
PODSUMOWANIE I WNIOSKI (Jan Burnewi
- Page 409 and 410:
nia od podstaw w wybranych regionac
- Page 411 and 412:
ski. Strategicznym (nadrzêdnym) ce
- Page 413 and 414:
struktorów samochodów elektryczny
- Page 415 and 416:
opracowan¹ z myœl¹ o ograniczeni
- Page 417 and 418:
acji lotniska i l¹dowiska. Wœród
- Page 419 and 420:
w¹tpliwych efektów wdra¿ania now
- Page 421 and 422:
œwiecie koncepcji i nowych rozwi¹
- Page 423 and 424:
nologie budownictwa infrastruktural
- Page 425 and 426:
TEN wpisany zosta³ projekt europej
- Page 427 and 428:
staw/ w ramach sieci dostaw (certyf
- Page 429 and 430:
nych), takich jak wprowadzanie ró
- Page 431 and 432:
obytu ludzie staj¹ siê coraz bard
- Page 433 and 434:
Trzy pierwsze typy procesów innowa
- Page 435 and 436:
który musi opracowywaæ nowatorski
- Page 437 and 438:
Przemiany technologiczne i innowacy
- Page 439 and 440:
ne uwidoczni³a siê ju¿ pod konie
- Page 441 and 442:
nia logistycznego, • stosowanie f
- Page 443 and 444:
Formalizacja oceny ryzyka w innowac
- Page 445 and 446:
List of tables Table 1. Innovation
- Page 447 and 448:
Table 50. Time horizon of risk fact
- Page 449 and 450:
Fig. 24. Strategic crossings within
- Page 451 and 452:
About Authors El¿bieta Adamowicz:
- Page 453:
Michel Savy: Professor in the Unive


