opsi manual opsi version 4.0.2 - opsi Download - uib
opsi manual opsi version 4.0.2 - opsi Download - uib
opsi manual opsi version 4.0.2 - opsi Download - uib

You also want an ePaper? Increase the reach of your titles
YUMPU automatically turns print PDFs into web optimized ePapers that Google loves.
<strong>opsi</strong> <strong>manual</strong> <strong>opsi</strong> <strong>version</strong> <strong>4.0.2</strong><br />
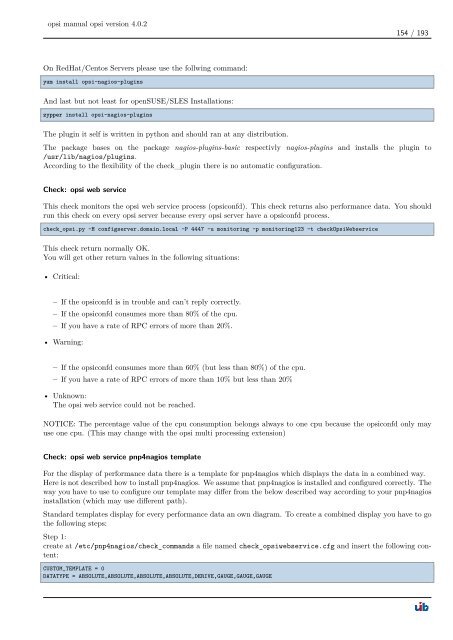
On RedHat/Centos Servers please use the follwing command:<br />
yum install <strong>opsi</strong>-nagios-plugins<br />
And last but not least for openSUSE/SLES Installations:<br />
zypper install <strong>opsi</strong>-nagios-plugins<br />
The plugin it self is written in python and should ran at any distribution.<br />
154 / 193<br />
The package bases on the package nagios-plugins-basic respectivly nagios-plugins and installs the plugin to<br />
/usr/lib/nagios/plugins.<br />
According to the flexibility of the check_plugin there is no automatic configuration.<br />
Check: <strong>opsi</strong> web service<br />
This check monitors the <strong>opsi</strong> web service process (<strong>opsi</strong>confd). This check returns also performance data. You should<br />
run this check on every <strong>opsi</strong> server because every <strong>opsi</strong> server have a <strong>opsi</strong>confd process.<br />
check_<strong>opsi</strong>.py -H configserver.domain.local -P 4447 -u monitoring -p monitoring123 -t checkOpsiWebservice<br />
This check return normally OK.<br />
You will get other return values in the following situations:<br />
• Critical:<br />
– If the <strong>opsi</strong>confd is in trouble and can’t reply correctly.<br />
– If the <strong>opsi</strong>confd consumes more than 80% of the cpu.<br />
– If you have a rate of RPC errors of more than 20%.<br />
• Warning:<br />
– If the <strong>opsi</strong>confd consumes more than 60% (but less than 80%) of the cpu.<br />
– If you have a rate of RPC errors of more than 10% but less than 20%<br />
• Unknown:<br />
The <strong>opsi</strong> web service could not be reached.<br />
NOTICE: The percentage value of the cpu consumption belongs always to one cpu because the <strong>opsi</strong>confd only may<br />
use one cpu. (This may change with the <strong>opsi</strong> multi processing extension)<br />
Check: <strong>opsi</strong> web service pnp4nagios template<br />
For the display of performance data there is a template for pnp4nagios which displays the data in a combined way.<br />
Here is not described how to install pnp4nagios. We assume that pnp4nagios is installed and configured correctly. The<br />
way you have to use to configure our template may differ from the below described way according to your pnp4nagios<br />
installation (which may use different path).<br />
Standard templates display for every performance data an own diagram. To create a combined display you have to go<br />
the following steps:<br />
Step 1:<br />
create at /etc/pnp4nagios/check_commands a file named check_<strong>opsi</strong>webservice.cfg and insert the following content:<br />
CUSTOM_TEMPLATE = 0<br />
DATATYPE = ABSOLUTE,ABSOLUTE,ABSOLUTE,ABSOLUTE,DERIVE,GAUGE,GAUGE,GAUGE