opsi manual opsi version 4.0.2 - opsi Download - uib
opsi manual opsi version 4.0.2 - opsi Download - uib
opsi manual opsi version 4.0.2 - opsi Download - uib

Create successful ePaper yourself
Turn your PDF publications into a flip-book with our unique Google optimized e-Paper software.
<strong>opsi</strong> <strong>manual</strong> <strong>opsi</strong> <strong>version</strong> <strong>4.0.2</strong><br />
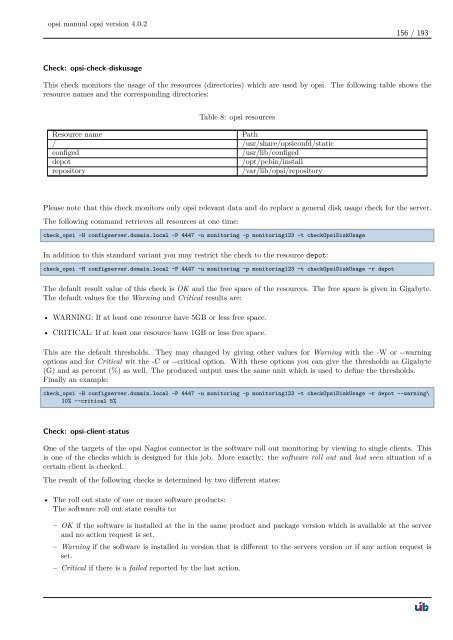
Check: <strong>opsi</strong>-check-diskusage<br />
156 / 193<br />
This check monitors the usage of the resources (directories) which are used by <strong>opsi</strong>. The following table shows the<br />
resource names and the corresponding directories:<br />
Table 8: <strong>opsi</strong> resources<br />
Resource name Path<br />
/ /usr/share/<strong>opsi</strong>confd/static<br />
configed /usr/lib/configed<br />
depot /opt/pcbin/install<br />
repository /var/lib/<strong>opsi</strong>/repository<br />
Please note that this check monitors only <strong>opsi</strong> relevant data and do replace a general disk usage check for the server.<br />
The following command retrieves all resources at one time:<br />
check_<strong>opsi</strong> -H configserver.domain.local -P 4447 -u monitoring -p monitoring123 -t checkOpsiDiskUsage<br />
In addition to this standard variant you may restrict the check to the resource depot:<br />
check_<strong>opsi</strong> -H configserver.domain.local -P 4447 -u monitoring -p monitoring123 -t checkOpsiDiskUsage -r depot<br />
The default result value of this check is OK and the free space of the resources. The free space is given in Gigabyte.<br />
The default values for the Warning and Critical results are:<br />
• WARNING: If at least one resource have 5GB or less free space.<br />
• CRITICAL: If at least one resource have 1GB or less free space.<br />
This are the default thresholds. They may changed by giving other values for Warning with the -W or --warning<br />
options and for Critical wit the -C or --critical option. With these options you can give the thresholds as Gigabyte<br />
(G) and as percent (%) as well. The produced output uses the same unit which is used to define the thresholds.<br />
Finally an example:<br />
check_<strong>opsi</strong> -H configserver.domain.local -P 4447 -u monitoring -p monitoring123 -t checkOpsiDiskUsage -r depot --warning\<br />
10% --critical 5%<br />
Check: <strong>opsi</strong>-client-status<br />
One of the targets of the <strong>opsi</strong> Nagios connector is the software roll out monitoring by viewing to single clients. This<br />
is one of the checks which is designed for this job. More exactly: the software roll out and last seen situation of a<br />
certain client is checked.<br />
The result of the following checks is determined by two different states:<br />
• The roll out state of one or more software products:<br />
The software roll out state results to:<br />
– OK if the software is installed at the in the same product and package <strong>version</strong> which is available at the server<br />
and no action request is set.<br />
– Warning if the software is installed in <strong>version</strong> that is different to the servers <strong>version</strong> or if any action request is<br />
set.<br />
– Critical if there is a failed reported by the last action.