R a p p o rt d 'a ctiv ité s 2 0 0 7 Rapport d'activités 2007 - paperJam
R a p p o rt d 'a ctiv ité s 2 0 0 7 Rapport d'activités 2007 - paperJam
R a p p o rt d 'a ctiv ité s 2 0 0 7 Rapport d'activités 2007 - paperJam

You also want an ePaper? Increase the reach of your titles
YUMPU automatically turns print PDFs into web optimized ePapers that Google loves.
La surveillance des organismes de placement collectif<br />
Distribution statistique des performances des unités à actions européennes<br />
Performance<br />
Classes de rendement<br />
Fréquence<br />
absolue<br />
Nombre d’unités<br />
Fréquence<br />
relative<br />
Fréquence<br />
absolue<br />
cumulée<br />
Fréquence<br />
relative<br />
cumulée<br />
-30% à -20% 1 0,32% 1 0,32%<br />
-20% à -10% 7 2,22% 8 2,53%<br />
-10% à -5% 29 9,18% 37 11,71%<br />
-5% à 0% 113 35,76% 150 47,47%<br />
0% à 5% 115 36,39% 265 83,86%<br />
5% à 10% 41 12,97% 306 96,84%<br />
10% à 20% 10 3,16% 316 100,00%<br />
Total 316 100,00%<br />
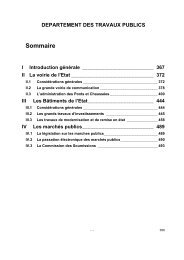
L’indice MSCI Europe Net Index (EUR), indice incluant les dividendes, a réalisé en <strong>2007</strong> une<br />
performance de 2,69%. 92 unités investissant dans des actions européennes, soit 29,11% du total,<br />
ont réalisé une performance supérieure à l’indice MSCI Europe Net Index (EUR). La volatilité de<br />
marché pour les actions européennes se chiffre à 15,85% (source : MSCI Barra, calcul CSSF).<br />
MSCI Europe Net Index (EUR) <strong>2007</strong><br />
Niveau d’indice<br />
170<br />
165<br />
160<br />
155<br />
150<br />
145<br />
140<br />
Jan 07<br />
Fev 07<br />
Mar 07<br />
Apr 07<br />
May 07<br />
Jun 07<br />
Jul 07<br />
Aug 07<br />
Sep 07<br />
Oct 07<br />
Nov 07<br />
Dec 07<br />
Source : MSCI Barra 13<br />
Interprétation du ratio de Sharpe :<br />
La population des unités d’OPC investissant dans des actions européennes a réalisé en <strong>2007</strong> en<br />
moyenne un rendement négatif de -0,38% par unité de risque prise en compte. Pour les performances<br />
de la classe de rendement maximal, on a pu observer en moyenne un rendement positif de 1,28%<br />
par unité de risque. Pour les performances de la classe de rendement minimal, on a pu observer en<br />
moyenne un rendement négatif de -1,51% par unité de risque prise en compte.<br />
13 This information is the exclusive prope<strong>rt</strong>y of Morgan Stanley Capital International Inc. (“MSCI”) and may not be reproduced<br />
or redisseminated in any form or used to create any financial products or indices without MSCI’s prior written permission. This<br />
information is provided “as is” and none of MSCI. Its affiliates or any other person involved in or related to the compilation<br />
of this information (colle<strong>ctiv</strong>ely, the “MSCI Pa<strong>rt</strong>ies”) makes any express or implied warranties or representations with respect<br />
to the information or the results to be obtained by the use thereof, and the MSCI Pa<strong>rt</strong>ies hereby expressly disclaim all implied<br />
warranties (including, without limitation, the implied warranties of merchantability and fitness for a pa<strong>rt</strong>icular purpose) with<br />
respect to this information. In no event shall any MSCI Pa<strong>rt</strong>y have any liability of any kind to any person or entity arising from<br />
or related to this information.<br />
60