- Seite 1 und 2: INSTITUT FÜR OSTSEEFORSCHUNG WARNE
- Seite 3 und 4: Meereswissenschaftliche Berichte MA
- Seite 5 und 6: I n h a l t Pollution Load Compilat
- Seite 7 und 8: Der Einfluss des Schifffahrtskanals
- Seite 9 und 10: Schernewski, G. & T. Dolch (eds.):
- Seite 11 und 12: Table 1 BOD5 load (tons) into the w
- Seite 13 und 14: Table 2 DIN load (tons) into the we
- Seite 15 und 16: 4 Are there signs for an improved w
- Seite 17 und 18: The flood led to higher concentrati
- Seite 19 und 20: The same tendency of the concentrat
- Seite 21 und 22: Table 6 Quality target (QT) and mea
- Seite 23: References BEHRENDT, H. & A. BACHOR
- Seite 26 und 27: 18 1 Introduction Along the souther
- Seite 28 und 29: 20 for nitrogen in the river. Groun
- Seite 30 und 31: 22 % o % o % o 6 5 4 3 2 1 0 6 5 4
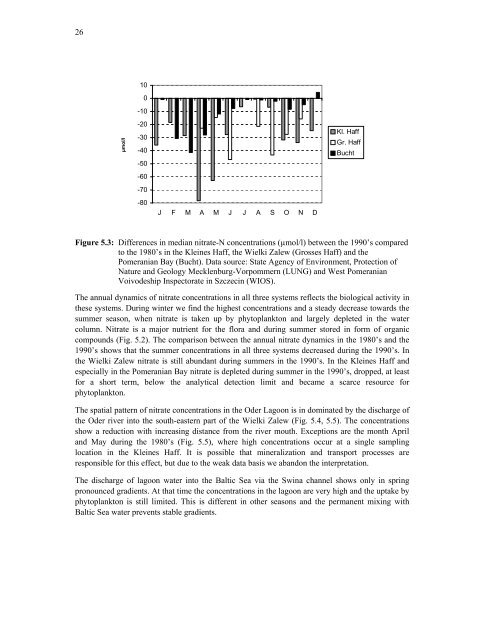
- Seite 32 und 33: 24 5 Nitrogen 5.1 Nitrate µmol/l
- Seite 36 und 37: 28 Keine Daten im Juli April Mai Ju
- Seite 38 und 39: 30 µmol/l µmol/l µmol/l 70 60 50
- Seite 40 und 41: 32 April Mai Juni Juli August Septe
- Seite 42 und 43: 34 5.3 Total-Nitrogen µmol/l µmol
- Seite 44 und 45: 36 35-45 %, ammonium 5-10 % and org
- Seite 46 und 47: 38 6 Phosphorous 6.1 Phosphate µmo
- Seite 48 und 49: 40 µmol/l 1 0 -1 -2 -3 -4 -5 -6 -7
- Seite 50 und 51: 42 Keine Daten im Juli April Mai Au
- Seite 52 und 53: 44 µmol/l µmol/l 20 18 16 14 12 1
- Seite 54 und 55: 46 6.3 Internal Eutrophication The
- Seite 56 und 57: 48 The values reflect the range of
- Seite 58 und 59: 50 µmol/l µmol/l 350 300 250 200
- Seite 60 und 61: 52 8 Chlorophyll µg/l µg/l µg/l
- Seite 62 und 63: 54 development of algae in the Pome
- Seite 64 und 65: 56 April Mai Keine Daten im Juli Ju
- Seite 66 und 67: m m m 58 2.5 2.0 1.5 1.0 0.5 0.0 2.
- Seite 68 und 69: 60 April Mai Juni Juli August Septe
- Seite 70 und 71: 62 10 The trophic state According t
- Seite 72 und 73: 64 BANGEL, H., G. SCHERNEWSKI & M.
- Seite 75 und 76: Schernewski, G. & T. Dolch (eds.):
- Seite 77 und 78: Gegenüber dieser Zielsetzung steht
- Seite 79 und 80: Peenestrom haben für den Wasseraus
- Seite 81 und 82: Einmal im Jahr findet eine gemeinsa
- Seite 83 und 84: Messstationen im Großen Haff fehle
- Seite 85 und 86:
Die Korrelationen zwischen den Rest
- Seite 87 und 88:
5.1 Zeitliche Repräsentativität S
- Seite 89 und 90:
5.3 Eignung des Monitorings zum rep
- Seite 91 und 92:
epräsentativere und stabilere Best
- Seite 93 und 94:
Schernewski, G. & T. Dolch (eds.):
- Seite 95 und 96:
Figure 2: Parameter input file of F
- Seite 97 und 98:
Oder river discharge into the lagoo
- Seite 100 und 101:
92 Figure 7: Trajectories of passiv
- Seite 102 und 103:
94 2 Spatial temperature developmen
- Seite 104 und 105:
96 Figure 9: Spatial temperature di
- Seite 107 und 108:
Schernewski, G. & T. Dolch (eds.):
- Seite 109 und 110:
The model covers major internal nut
- Seite 111 und 112:
103 Atmospheric deposition (which c
- Seite 113 und 114:
ecalculated into salinity using for
- Seite 115 und 116:
Iopt values (Figure 2.3) were adopt
- Seite 117 und 118:
processes, as it is in the case of
- Seite 119 und 120:
Table 3.1 Sensitivity index values
- Seite 121 und 122:
the Kleines Haff are higher, indica
- Seite 123 und 124:
mmol/m^3 mmol/m^3 18 15 12 9 6 3 PO
- Seite 125 und 126:
117 3.3.2 Primary production Primar
- Seite 127 und 128:
3.4 Retention of nutrients within t
- Seite 129 und 130:
NOWAK (1980), only 10% of the river
- Seite 131 und 132:
tons/a tons/a 15,000 12,500 10,000
- Seite 133 und 134:
SIEGEL, H. GERTH, M., (personal com
- Seite 135 und 136:
Schernewski, G. & T. Dolch (eds.):
- Seite 137 und 138:
1 Einleitung Seit jeher sind Gewäs
- Seite 139 und 140:
Teilen des Haffs werden Tiefen bis
- Seite 141 und 142:
2.4.3 Nährstoffdynamik Die Einträ
- Seite 143 und 144:
eingeleiteter Maßnahmen dokumentie
- Seite 145 und 146:
Um neben dem Endobenthos im Sedimen
- Seite 147 und 148:
Tab. 4.3 Position und Beschreibung
- Seite 149 und 150:
Einzelfund : das Taxon wurde durch
- Seite 151 und 152:
5 Ergebnisse 5.1 Besiedlung des Ufe
- Seite 153 und 154:
Stepnica (ste11) Czarnocin (cza11)
- Seite 155 und 156:
Cluster I enthält die Proben aus M
- Seite 157 und 158:
Vergleicht man hingegen die Taxa, d
- Seite 159 und 160:
Der Einfluss der Sedimentzusammense
- Seite 161 und 162:
wurden nicht genommen. Anzumerken s
- Seite 163 und 164:
Bereich des Schifffahrtskanals mit
- Seite 165 und 166:
Dreissena polymorpha (Mollusca) und
- Seite 167 und 168:
von Potamotrix hammoniensis an. Ebe
- Seite 169 und 170:
Strandabschnitte voneinander trenne
- Seite 171 und 172:
Ähnlich wie an Seeufern scheint de
- Seite 173 und 174:
Küstensaum bis zur Wassertiefe von
- Seite 175 und 176:
Lebensraum im Haff. Sie gehören da
- Seite 177 und 178:
BÖHMER et al. (1999) schlagen als
- Seite 179 und 180:
• stattfinden. Der Zeitraum der s
- Seite 181 und 182:
Außerdem zeichnet sich die Hafffau
- Seite 183 und 184:
Literatur AQEM CONSORTIUM, 2002: Ma
- Seite 185 und 186:
REMANE, A. & C. SCHLIEPER, 1971: Bi
- Seite 187 und 188:
Schernewski, G. & T. Dolch (eds.):
- Seite 189 und 190:
2 Untersuchungsgebiet und Hintergru
- Seite 191 und 192:
3.480 m³/s beobachtet. Im mehrjäh
- Seite 193 und 194:
Sanden bzw. sandigen Schlicken in f
- Seite 195 und 196:
3 Material und Methoden 3.1 Datener
- Seite 197 und 198:
Verwendet wurde jeweils ein halbes
- Seite 199 und 200:
Parameter, wie beispielsweise die R
- Seite 201 und 202:
30 25 20 15 10 5 0 Abb. 4.1 - 2 Gl
- Seite 203 und 204:
Stickstoff (N) 16 14 12 10 8 6 4 2
- Seite 205 und 206:
2,39 gemessen wurde. Von Probe 4 bi
- Seite 207 und 208:
Nassbaggergut aus der Rinne entnomm
- Seite 209 und 210:
Abb. 4.5 - 2 Lage des Kanalquerschn
- Seite 211 und 212:
Errechnet wurde, dass die Fließges
- Seite 213 und 214:
Baggergutmengen, die in den vergang
- Seite 215 und 216:
Schiffsverkehr im Kanal führt zu e
- Seite 217 und 218:
pflanzenverfügbare Form umgewandel
- Seite 219 und 220:
211 schwerlöslichen Eisenverbindun
- Seite 221 und 222:
stoffliche Voraussetzungen bieten.
- Seite 223 und 224:
Abb. 5.4.1 - 1 Schematischer Quersc
- Seite 225 und 226:
Windrichtungen zunehmen wird. Der A
- Seite 227 und 228:
Danksagung Mein Dank gilt allen, di
- Seite 229 und 230:
LANDESUMWELTAMT BRANDENBURG (Hrsg.)
- Seite 231 und 232:
Schernewski, G. & T. Dolch (eds.):
- Seite 233 und 234:
eiden Urlaubsgebieten in Bezug auf
- Seite 235 und 236:
Das Stettiner Haff ist eine 687 km
- Seite 237 und 238:
Tab. 3.2.1 Die fünf Parameter mit
- Seite 239 und 240:
Tab. 3.3.1 Klassifizierung nach Tro
- Seite 241 und 242:
Überwachte Badestellen (mit Zuordn
- Seite 243 und 244:
nicht nur auf die Produzenten und n
- Seite 245 und 246:
4 Entwicklung und Bedeutung des Tou
- Seite 247 und 248:
den starken positiven Entwicklungst
- Seite 249 und 250:
aufweisen, können Hotels mit vier
- Seite 251 und 252:
5 Methodik Im Untersuchungsgebiet w
- Seite 253 und 254:
Daten bezüglich der Badewasserqual
- Seite 255 und 256:
Jahr letztmalig dort im Urlaub. 17
- Seite 257 und 258:
70 60 50 40 % 30 20 10 0 sehr wicht
- Seite 259 und 260:
warme Wassertemperatur klares, blau
- Seite 261 und 262:
60 Usedomtouristen Hafftouristen Di
- Seite 263 und 264:
Usedomtouristen Usedom und 3,18 am
- Seite 265 und 266:
Usedom mit 19,7 % vertreten und am
- Seite 267 und 268:
Kaiserbädern. Diese Zahlenverhält
- Seite 269 und 270:
7 Diskussion 7.1 Methodenkritik Fü
- Seite 271 und 272:
Frage nach der Bedeutung der Wasser
- Seite 273 und 274:
Foto 7.3.1 & 7.3.2 Das Flair der Ka
- Seite 275 und 276:
Zudem wurde in Frage 12 gefragt, in
- Seite 277 und 278:
Medien vertreten als die Ostsee. In
- Seite 279 und 280:
Tab 7.5.1 Badewasserqualität ausge
- Seite 281 und 282:
meeres- bzw. küstenbezogene Themen
- Seite 283 und 284:
Aufgrund der Tatsache, dass der Tou
- Seite 285 und 286:
niedrigen Übernachtungspreise nich
- Seite 287 und 288:
Mangel von keiner Algenart kompensi
- Seite 289 und 290:
zukünftige Entwicklung der Wasserq
- Seite 291 und 292:
Danksagung Mein herzlicher Dank gil
- Seite 293 und 294:
NIXON, S. W., 1995: Coastal marine
- Seite 295 und 296:
EUROPÄISCHE UNION, 2002: Bathing W
- Seite 297 und 298:
Meereswissenschaftliche Berichte MA
- Seite 299 und 300:
29 (1998) Matthäus, Wolfgang; Naus
- Seite 302:
SCHERNEWSKI, G.; DOLCH, T.: The Ode