The genus Cinnamomum
The genus Cinnamomum
The genus Cinnamomum

Create successful ePaper yourself
Turn your PDF publications into a flip-book with our unique Google optimized e-Paper software.
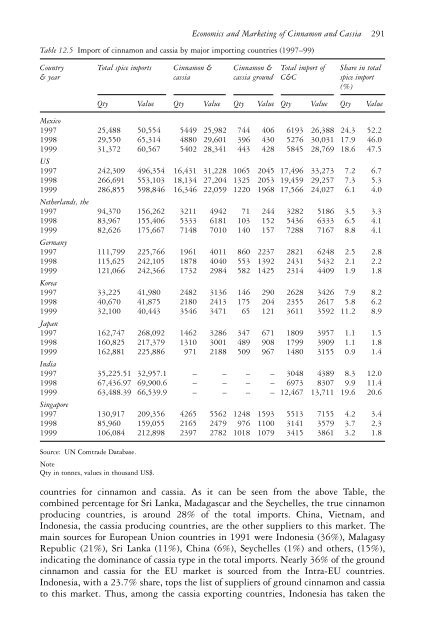
Economics and Marketing of Cinnamon and Cassia 291<br />
Table 12.5 Import of cinnamon and cassia by major importing countries (1997–99)<br />
Country Total spice imports Cinnamon & Cinnamon & Total import of Share in total<br />
& year cassia cassia ground C&C spice import<br />
(%)<br />
Qty Value Qty Value Qty Value Qty Value Qty Value<br />
Mexico<br />
1997 25,488 50,554 5449 25,982 744 406 6193 26,388 24.3 52.2<br />
1998 29,550 65,314 4880 29,601 396 430 5276 30,031 17.9 46.0<br />
1999 31,372 60,567 5402 28,341 443 428 5845 28,769 18.6 47.5<br />
US<br />
1997 242,309 496,354 16,431 31,228 1065 2045 17,496 33,273 7.2 6.7<br />
1998 266,691 553,103 18,134 27,204 1325 2053 19,459 29,257 7.3 5.3<br />
1999 286,855 598,846 16,346 22,059 1220 1968 17,566 24,027 6.1 4.0<br />
Netherlands, the<br />
1997 94,370 156,262 3211 4942 71 244 3282 5186 3.5 3.3<br />
1998 83,967 155,406 5333 6181 103 152 5436 6333 6.5 4.1<br />
1999 82,626 175,667 7148 7010 140 157 7288 7167 8.8 4.1<br />
Germany<br />
1997 111,799 225,766 1961 4011 860 2237 2821 6248 2.5 2.8<br />
1998 115,625 242,105 1878 4040 553 1392 2431 5432 2.1 2.2<br />
1999 121,066 242,366 1732 2984 582 1425 2314 4409 1.9 1.8<br />
Korea<br />
1997 33,225 41,980 2482 3136 146 290 2628 3426 7.9 8.2<br />
1998 40,670 41,875 2180 2413 175 204 2355 2617 5.8 6.2<br />
1999 32,100 40,443 3546 3471 65 121 3611 3592 11.2 8.9<br />
Japan<br />
1997 162,747 268,092 1462 3286 347 671 1809 3957 1.1 1.5<br />
1998 160,825 217,379 1310 3001 489 908 1799 3909 1.1 1.8<br />
1999 162,881 225,886 971 2188 509 967 1480 3155 0.9 1.4<br />
India<br />
1997 35,225.51 32,957.1 – – – – 3048 4389 8.3 12.0<br />
1998 67,436.97 69,900.6 – – – – 6973 8307 9.9 11.4<br />
1999 63,488.39 66,539.9 – – – – 12,467 13,711 19.6 20.6<br />
Singapore<br />
1997 130,917 209,356 4265 5562 1248 1593 5513 7155 4.2 3.4<br />
1998 85,960 159,055 2165 2479 976 1100 3141 3579 3.7 2.3<br />
1999 106,084 212,898 2397 2782 1018 1079 3415 3861 3.2 1.8<br />
Source: UN Comtrade Database.<br />
Note<br />
Qty in tonnes, values in thousand US$.<br />
countries for cinnamon and cassia. As it can be seen from the above Table, the<br />
combined percentage for Sri Lanka, Madagascar and the Seychelles, the true cinnamon<br />
producing countries, is around 28% of the total imports. China, Vietnam, and<br />
Indonesia, the cassia producing countries, are the other suppliers to this market. <strong>The</strong><br />
main sources for European Union countries in 1991 were Indonesia (36%), Malagasy<br />
Republic (21%), Sri Lanka (11%), China (6%), Seychelles (1%) and others, (15%),<br />
indicating the dominance of cassia type in the total imports. Nearly 36% of the ground<br />
cinnamon and cassia for the EU market is sourced from the Intra-EU countries.<br />
Indonesia, with a 23.7% share, tops the list of suppliers of ground cinnamon and cassia<br />
to this market. Thus, among the cassia exporting countries, Indonesia has taken the