- Page 2 and 3:
Cinnamon and Cassia The genus Cinna
- Page 4 and 5:
Cinnamon and Cassia The genus Cinna
- Page 6:
This volume is dedicated to Prof. (
- Page 9 and 10:
viii Contents 10 Pests and diseases
- Page 11 and 12:
x Contributors Subhan C. Nath Regio
- Page 13 and 14:
xii Preface to the series compounds
- Page 15 and 16:
xiv Preface When we approached the
- Page 18 and 19:
1 Introduction P.N. Ravindran and K
- Page 20 and 21:
French Casse, Canefice, Canelle de
- Page 22 and 23:
Introduction 5 were accomplished sa
- Page 24 and 25:
Introduction 7 It seems quite proba
- Page 26 and 27:
Introduction 9 rose to 450,000 kg.
- Page 28 and 29:
Introduction 11 Sri Lanka has been
- Page 30 and 31:
Introduction 13 ISO (1977) Oil of c
- Page 32 and 33:
Botany and Crop Improvement of Cinn
- Page 34 and 35:
(a) (c) Botany and Crop Improvement
- Page 36 and 37:
Botany and Crop Improvement of Cinn
- Page 38 and 39:
Indian cassia leaves (known as ‘T
- Page 40 and 41:
Botany and Crop Improvement of Cinn
- Page 42 and 43:
Botany and Crop Improvement of Cinn
- Page 44 and 45:
Botany and Crop Improvement of Cinn
- Page 46 and 47:
1 2 Botany and Crop Improvement of
- Page 48 and 49:
Table 2.4 Stomatal characteristics
- Page 50 and 51:
1 3 4 Collenchyma Stone cell Phloem
- Page 52 and 53:
Botany and Crop Improvement of Cinn
- Page 54 and 55:
Table 2.6 Microscopic characteristi
- Page 56 and 57:
(k) Medullary 2 cells wide, radiall
- Page 58 and 59:
Botany and Crop Improvement of Cinn
- Page 60 and 61:
1 7 1a 7 Wood anatomy 4 6 2 2a Bota
- Page 62 and 63:
(a) (b) Morning Botany and Crop I
- Page 64 and 65:
1 2 3 4 6 8 9 Botany and Crop Impro
- Page 66 and 67:
Botany and Crop Improvement of Cinn
- Page 68 and 69:
Botany and Crop Improvement of Cinn
- Page 70 and 71:
Botany and Crop Improvement of Cinn
- Page 72 and 73:
Botany and Crop Improvement of Cinn
- Page 74 and 75:
Botany and Crop Improvement of Cinn
- Page 76 and 77:
Botany and Crop Improvement of Cinn
- Page 78 and 79:
viability is completely lost (Kanna
- Page 80 and 81:
Botany and Crop Improvement of Cinn
- Page 82 and 83:
Other tissue culture studies Botany
- Page 84 and 85:
Table 2.11 Bark and leaf oil consti
- Page 86 and 87:
Table 2.13 Growth and yield paramet
- Page 88 and 89:
Botany and Crop Improvement of Cinn
- Page 90 and 91:
Little crop improvement work has go
- Page 92 and 93:
Botany and Crop Improvement of Cinn
- Page 94 and 95:
Botany and Crop Improvement of Cinn
- Page 96 and 97:
Botany and Crop Improvement of Cinn
- Page 98 and 99:
Chemistry of Cinnamon and Cassia 81
- Page 100 and 101:
Chemistry of Cinnamon and Cassia 83
- Page 102 and 103:
Chemistry of Cinnamon and Cassia 85
- Page 104 and 105:
Table 3.4 Volatile constituents ide
- Page 106 and 107:
Chemistry of Cinnamon and Cassia 89
- Page 108 and 109:
Chemistry of Cinnamon and Cassia 91
- Page 110 and 111:
HO Chemistry of Cinnamon and Cassia
- Page 112 and 113:
Chemistry of Cinnamon and Cassia 95
- Page 114 and 115:
Chemistry of Cinnamon and Cassia 97
- Page 116 and 117:
-Humulene 1.30 0.57 0.12 1.40 -Cube
- Page 118 and 119:
1 3 2 4 4 5 7 6 8 10 9 12 11 13 14
- Page 120 and 121:
1147 Isoborneol 0.36 0.55 1158 Born
- Page 122 and 123:
Chemistry of Cinnamon and Cassia 10
- Page 124 and 125:
opportunities lies in the new centu
- Page 126 and 127:
R OH 4 HO O O O OH Chemistry of Cin
- Page 128 and 129:
Chemistry of Cinnamon and Cassia 11
- Page 130 and 131:
Chemistry of Cinnamon and Cassia 11
- Page 132 and 133:
p-Cymene 13 21.35 0.82 -Copaene 0.4
- Page 134 and 135:
(E)-cinnamyl acetate 0.1 0.2-2.2 -3
- Page 136 and 137:
Annex 3.3 The chemical structure of
- Page 138 and 139:
4 Cultivation and Management of Cin
- Page 140 and 141:
Figure 4.2 Field plantation of cinn
- Page 142 and 143:
the age of three to four months exc
- Page 144 and 145:
Cultivation and Management of Cinna
- Page 146 and 147:
Cultivation and Management of Cinna
- Page 148 and 149:
HARVESTED CINNAMON Cutting Extracti
- Page 150 and 151:
(a) (b) Figure 5.3 (a) Cinnamon pee
- Page 152 and 153:
Chips Harvesting, Processing, and Q
- Page 154 and 155:
cassia oils, is obtained from disti
- Page 156 and 157:
KETTLE FURNACE Harvesting, Processi
- Page 158 and 159:
the oleoresin is stored in suitable
- Page 160 and 161:
Grades The Cinnamon bark shall have
- Page 162 and 163:
Quality of Reagents Unless specifie
- Page 164 and 165:
Cinnamon powder Harvesting, Process
- Page 166 and 167:
Table 5A.5 Chemical requirements Ha
- Page 168 and 169:
Harvesting, Processing, and Quality
- Page 170 and 171:
Special protection information Resp
- Page 172 and 173:
Ash Refer to Annex 5.3. Acid insolu
- Page 174 and 175:
Chinese Cassia 157 Figure 6.1 Cinna
- Page 176 and 177:
Figure 6.2 A 15-year old plantation
- Page 178 and 179:
Chinese Cassia 161 careful harrowin
- Page 180 and 181:
make it easier to climb and to avoi
- Page 182 and 183:
Adulterations and substitutes In ea
- Page 184 and 185:
Chinese Cassia 167 various regions
- Page 186 and 187:
Table 6.4 Insect pests of cassia ci
- Page 188 and 189:
Chinese Cassia 171 Table 6.5 Compos
- Page 190 and 191:
Trace Methyl eugenol Trace Benzoic
- Page 192 and 193:
Table 6.9 Comparative percentages,
- Page 194 and 195:
Chinese Cassia 177 (3-5°C) or due
- Page 196 and 197:
Chinese Cassia 179 curing diseases
- Page 198 and 199:
Chinese Cassia 181 different parts
- Page 200 and 201:
Chinese Cassia 183 Kashiwada, Y., N
- Page 202 and 203:
7 Indonesian Cassia (Indonesian Cin
- Page 204 and 205:
propagation is possible through cut
- Page 206 and 207:
Indonesian Cassia (Indonesian Cinna
- Page 208 and 209:
Figure 7.3 Separation of bark by be
- Page 210 and 211:
the branch. The mycelium layer pene
- Page 212 and 213:
Table 7.4 The yield and characteris
- Page 214 and 215:
Conclusion In spite of the fact tha
- Page 216 and 217:
8 Indian Cassia Akhil Baruah and Su
- Page 218 and 219:
Indian Cassia 201 pollen dehiscence
- Page 220 and 221:
Indian Cassia 203 Ecology and distr
- Page 222 and 223:
Table 8.1 Physico-chemical characte
- Page 224 and 225:
Indian Cassia 207 Table 8.4 Composi
- Page 226 and 227:
References Indian Cassia 209 Anonym
- Page 228 and 229:
9 Camphor Tree K. Nirmal Babu, P.N.
- Page 230 and 231:
Sub-specific division of C. camphor
- Page 232 and 233:
Camphor Tree 215 succession species
- Page 234 and 235:
The condenser is the most bulky and
- Page 236 and 237:
Table 9.1 Relation between age of t
- Page 238 and 239:
Table 9.3 Yield of camphor and oil
- Page 240 and 241:
Camphor Tree 223 Yu-Sho oil: Specif
- Page 242 and 243:
Ketones and oxides: Camphor, piperi
- Page 244 and 245:
Camphor Tree 227 20 Citronellyl ace
- Page 246 and 247:
Table 9.12 Chemical composition (%)
- Page 248 and 249:
Camphor Tree 231 Table 9.14 Yield a
- Page 250 and 251:
Camphor Tree 233 Table 9.18 Physico
- Page 252 and 253:
Camphor Tree 235 To prevent bed-sor
- Page 254 and 255:
Camphor Tree 237 Chopra, R.N., Chop
- Page 256 and 257:
10 Pests and Diseases of Cinnamon a
- Page 258 and 259:
Family: Dermestidae Evorinea hirtel
- Page 260 and 261:
Pests and Diseases of Cinnamon and
- Page 262 and 263:
Pests and Diseases of Cinnamon and
- Page 264 and 265:
Leaf webber (Orthaga vitalis) Pests
- Page 266 and 267:
C. malabatrum Meliola beilschmiedia
- Page 268 and 269:
Pests and Diseases of Cinnamon and
- Page 270 and 271: Pests and Diseases of Cinnamon and
- Page 272 and 273: Pests and Diseases of Cinnamon and
- Page 274 and 275: Pests and Diseases of Cinnamon and
- Page 276 and 277: 11 Pharmacology and Toxicology of C
- Page 278 and 279: Anti-inflammatory action Pharmacolo
- Page 280 and 281: Pharmacology and Toxicology of Cinn
- Page 282 and 283: Pharmacology and Toxicology of Cinn
- Page 284 and 285: Pharmacology and Toxicology of Cinn
- Page 286 and 287: Table 11.1 Antibacterial effects of
- Page 288 and 289: Pharmacology and Toxicology of Cinn
- Page 290 and 291: Table 11.2 Antifungal activity of c
- Page 292 and 293: Pharmacology and Toxicology of Cinn
- Page 294 and 295: Pharmacology and Toxicology of Cinn
- Page 296 and 297: Pharmacology and Toxicology of Cinn
- Page 298 and 299: Pharmacology and Toxicology of Cinn
- Page 300 and 301: Pharmacology and Toxicology of Cinn
- Page 302 and 303: 12 Economics and Marketing of Cinna
- Page 304 and 305: Economics and Marketing of Cinnamon
- Page 306 and 307: Economics and Marketing of Cinnamon
- Page 308 and 309: Economics and Marketing of Cinnamon
- Page 310 and 311: Table 12.7 US imports of whole cass
- Page 312 and 313: Japan Economics and Marketing of Ci
- Page 314 and 315: Economics and Marketing of Cinnamon
- Page 316 and 317: Table 12.14 US exports of cassia an
- Page 318 and 319: Table 12.16 World exports of cinnam
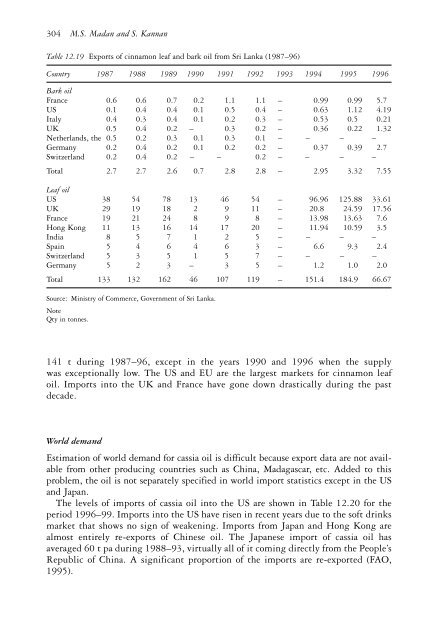
- Page 322 and 323: Table 12.20 US imports of cassia oi
- Page 324 and 325: Economics and Marketing of Cinnamon
- Page 326 and 327: S t 0.37Y t 0.63S t1 Economics an
- Page 328 and 329: 13 End Uses of Cinnamon and Cassia
- Page 330 and 331: Table 13.3 Typical western pickling
- Page 332 and 333: End Uses of Cinnamon and Cassia 315
- Page 334 and 335: Table 13.9 Relative flavour intensi
- Page 336 and 337: Cinnamon - in perfumes and beauty c
- Page 338 and 339: End Uses of Cinnamon and Cassia 321
- Page 340 and 341: Chinese Cassia Chinese cassia - as
- Page 342 and 343: End Uses of Cinnamon and Cassia 325
- Page 344 and 345: 14 Cinnamon and Cassia - The Future
- Page 346 and 347: Cinnamon and Cassia - The Future Vi
- Page 348 and 349: Table 15.1 Chemical composition of
- Page 350 and 351: Table 15.3 Constituents of leaf oil
- Page 352 and 353: cloves. Leaves measure 3-12 1.5-4
- Page 354 and 355: C. deschampsii Gamble C. deschampsi
- Page 356 and 357: Table 15.7 Composition of essential
- Page 358 and 359: Other Useful Species of Cinnamomum
- Page 360 and 361: Table 15.9 Compounds identified in
- Page 362 and 363: C. sulphuratum Nees Other Useful Sp
- Page 364 and 365: Table 15.13 Percentage composition
- Page 366 and 367: Other Useful Species of Cinnamomum
- Page 368 and 369: Other Useful Species of Cinnamomum
- Page 370 and 371:
Other Useful Species of Cinnamomum
- Page 372 and 373:
Other Useful Species of Cinnamomum
- Page 374 and 375:
location 90 physico-chemical proper
- Page 376 and 377:
mass spectrometric studies 97 extra
- Page 378 and 379:
metabolic studies 267 sedative effe