- Page 1 and 2:
Proceedings <stron
- Page 3 and 4:
Contents Paper Title Author(s) Page
- Page 5 and 6:
Paper Title Author(s) Page No. Main
- Page 7 and 8:
Paper Title Author(s) Page No. Know
- Page 9 and 10:
Preface These proceedings represent
- Page 11 and 12:
TU Dortmund, Germany, ); Wing Bun L
- Page 13 and 14:
William Halal is Prof</stro
- Page 15 and 16:
Evgeny Blagov has obtained a specia
- Page 17 and 18:
science and mathem
- Page 19 and 20:
George Majdalany is a PhD candidate
- Page 21 and 22:
Joyce Nesamani Simson is a PhD cand
- Page 23 and 24:
Manpower Discipline Based on Knowle
- Page 25 and 26:
Peyman Akhavan et al. brains, knowl
- Page 27 and 28:
Peyman Akhavan et al. showed that o
- Page 29 and 30:
Peyman Akhavan et al. appropriate l
- Page 31 and 32:
Peyman Akhavan et al. sources for c
- Page 33 and 34:
Attitudes Towards Changes and Organ
- Page 35 and 36:
Ruth Alas et al. During the
- Page 37 and 38:
Professional inter
- Page 39 and 40:
Ruth Alas et al. Table 4: Correlati
- Page 41 and 42:
Research was supported by ETF Grant
- Page 43 and 44:
Rivadávia Correa Drummond de Alvar
- Page 45 and 46:
Rivadávia Correa Drummond de Alvar
- Page 47 and 48:
Rivadávia Correa Drummond de Alvar
- Page 49 and 50:
Rivadávia Correa Drummond de Alvar
- Page 51 and 52:
5. Conclusions Rivadávia Correa Dr
- Page 53 and 54:
Rivadávia Correa Drummond de Alvar
- Page 55 and 56:
Toward a Meta-Synthe</stron
- Page 57 and 58:
Xiaomi An et al 2.3 Reasons for dev
- Page 59 and 60:
Xiaomi An et al PTC works closely w
- Page 61 and 62:
Xiaomi An et al The first is an adm
- Page 63 and 64:
Xiaomi An et al policy reflections
- Page 65 and 66:
Figure 1: Transmission gear Marko A
- Page 67 and 68:
Marko Anzelak et al. knowledge basi
- Page 69 and 70:
Marko Anzelak et al. 72% recognise
- Page 71 and 72:
Marko Anzelak et al. virtually all
- Page 73 and 74:
Gabriel Prananingrum Aryanindita an
- Page 75 and 76:
Gabriel Prananingrum Aryanindita an
- Page 77 and 78:
Gabriel Prananingrum Aryanindita an
- Page 79 and 80:
Rita Babiliūtė and Kęstutis Kri
- Page 81 and 82:
Rita Babiliūtė and Kęstutis Kri
- Page 83 and 84:
Rita Babiliūtė and Kęstutis Kri
- Page 85 and 86:
Rita Babiliūtė and Kęstutis Kri
- Page 87 and 88:
Knowledge Management, Cultural Know
- Page 89 and 90:
Leonard Barnett and Edward Carter 2
- Page 91 and 92:
Leonard Barnett and Edward Carter p
- Page 93 and 94:
Leonard Barnett and Edward Carter p
- Page 95 and 96:
Leonard Barnett and Edward Carter d
- Page 97 and 98:
Impact of Knowledg
- Page 99 and 100:
Bob Barrett shorter product life-cy
- Page 101 and 102:
Bob Barrett 6. Concept of</
- Page 103 and 104:
Bob Barrett Brown, J.S. and Duguid
- Page 105 and 106:
Aurilla Aurelie Bechina and Eli Hus
- Page 107 and 108:
Aurilla Aurelie Bechina and Eli Hus
- Page 109 and 110:
Aurilla Aurelie Bechina and Eli Hus
- Page 111 and 112:
Aurilla Aurelie Bechina and Eli Hus
- Page 113 and 114:
Lorne Booker et al. Knowledge is us
- Page 115 and 116:
Figure 1: Business Valuation Knowle
- Page 117 and 118:
3.4 Practitioner knowledge market L
- Page 119 and 120:
4. Implications Lorne Booker et al.
- Page 121 and 122:
Strategic Thinking Dimensions in Em
- Page 123 and 124:
Constantin Bratianu et al. shows <s
- Page 125 and 126:
Constantin Bratianu et al. Academy
- Page 127 and 128:
Constantin Bratianu et al. cases wi
- Page 129 and 130:
Constantin Bratianu et al. Pinker,
- Page 131 and 132:
Delio Ignacio Castañeda and Sandra
- Page 133 and 134:
Delio Ignacio Castañeda and Sandra
- Page 135 and 136:
Delio Ignacio Castañeda and Sandra
- Page 137 and 138:
Quality in Teacher Education: A Sys
- Page 139 and 140:
Rajendra Chetty The mechanism <stro
- Page 141 and 142:
Academic leadership Rajendra Chetty
- Page 143 and 144:
Rajendra Chetty There must be a re-
- Page 145 and 146:
Developing Personal Knowledge Manag
- Page 147 and 148:
Thirathep Chonmait
- Page 149 and 150:
Thirathep Chonmait
- Page 151 and 152:
The Relationship Between Knowledge
- Page 153 and 154:
Samuel Kai Wah Chu et al. A knowled
- Page 155 and 156:
Samuel Kai Wah Chu et al. negative
- Page 157 and 158:
Samuel Kai Wah Chu et al. Questionn
- Page 159 and 160:
Samuel Kai Wah Chu et al. few done
- Page 161 and 162:
Value Creation Through Collaborativ
- Page 163 and 164:
Ridha Derrouiche et al. level for e
- Page 165 and 166:
Ridha Derrouiche et al. best, <stro
- Page 167 and 168:
Ridha Derrouiche et al. experience
- Page 169 and 170:
Ridha Derrouiche et al. Of course,
- Page 171 and 172:
Organizational Learning and Transfo
- Page 173 and 174:
Irra Chrisyanti Dewi was carried ou
- Page 175 and 176:
Irra Chrisyanti Dewi Table 2: Valid
- Page 177 and 178:
Irra Chrisyanti Dewi Library is exp
- Page 179 and 180:
Knowledge Acquisition and Sharing:
- Page 181 and 182:
Ikechukwu Diugwu articulated and st
- Page 183 and 184:
Ikechukwu Diugwu establishing setti
- Page 185 and 186:
Ikechukwu Diugwu Mentzer, J. T., Mi
- Page 187 and 188:
Eva Eckenhofer cou
- Page 189 and 190:
Eva Eckenhofer The
- Page 191 and 192:
Eva Eckenhofer The
- Page 193 and 194:
Eva Eckenhofer Bur
- Page 195 and 196:
1.2 Intellectual capital and innova
- Page 197 and 198:
3.2.2 Reliability Irene Y.H. Fan an
- Page 199 and 200:
Figure 4: latent variable coefficie
- Page 201 and 202:
Irene Y.H. Fan and Rongbin W.B. Lee
- Page 203 and 204:
Irene Y.H. Fan and Rongbin W.B. Lee
- Page 205 and 206:
2.1 Appropriation Ronny Gey From a
- Page 207 and 208:
Ronny Gey Table 1: Characterization
- Page 209 and 210:
Ronny Gey The developers feel that
- Page 211 and 212:
Ronny Gey A first limitation we wer
- Page 213 and 214:
Kenneth Grant part of</stro
- Page 215 and 216:
Kenneth Grant The diffusion was stu
- Page 217 and 218:
Kenneth Grant A detailed computer-s
- Page 219 and 220:
Kenneth Grant did not come to <stro
- Page 221 and 222:
Kenneth Grant of m
- Page 223 and 224:
Michel Grundstein although hundred
- Page 225 and 226:
Michel Grundstein Figure 1: DITEK p
- Page 227 and 228:
Michel Grundstein 4.1.1 Knowledge i
- Page 229 and 230:
Michel Grundstein share. However <s
- Page 231 and 232:
6. Conclusions and perspectives Mic
- Page 233 and 234:
Intellectual Property Valuation Dec
- Page 235 and 236:
Hezlin Harris et al. (Burrone and S
- Page 237 and 238:
Hezlin Harris et al. The need for s
- Page 239 and 240:
Acknowledgements Hezlin Harris et a
- Page 241 and 242:
Managing an Assessment Process <str
- Page 243 and 244:
Table 1: List of N
- Page 245 and 246:
Shaheed Hartley Table 3: OEQ respon
- Page 247 and 248:
Shaheed Hartley It is very difficul
- Page 249 and 250:
A Community Framework for Knowledge
- Page 251 and 252:
Igor Hawryszkiewycz between communi
- Page 253 and 254:
Figure 4: Modeling knowledge subsys
- Page 255 and 256:
Igor Hawryszkiewycz Prahalad, C.K.,
- Page 257 and 258:
Eli Hustad and Aurilla Aurelie Bech
- Page 259 and 260:
Eli Hustad and Aurilla Aurelie Bech
- Page 261 and 262:
Eli Hustad and Aurilla Aurelie Bech
- Page 263 and 264:
Eli Hustad and Aurilla Aurelie Bech
- Page 265 and 266:
Does Knowledge Stickiness Affect a
- Page 267 and 268:
Nurul Indarti knowledge (Nelson and
- Page 269 and 270:
3. Research methods 3.1 Research in
- Page 271 and 272:
Coded knowledge Nurul Indarti The f
- Page 273 and 274:
Nurul Indarti Arrow, K. J. (1969).
- Page 275 and 276:
Organizational Learning in Pr<stron
- Page 277 and 278:
Brigita Janiunaite et al. learn and
- Page 279 and 280:
Brigita Janiunaite et al. given dif
- Page 281 and 282:
Brigita Janiunaite et al. empowered
- Page 283 and 284:
Brigita Janiunaite et al. A statist
- Page 285 and 286:
Brigita Janiunaite et al. learning
- Page 287 and 288:
Balancing the Ince
- Page 289 and 290:
Giedrius Jucevičius safeguard and
- Page 291 and 292:
Giedrius Jucevičius nature <strong
- Page 293 and 294:
Giedrius Jucevičius motivating fac
- Page 295 and 296:
Giedrius Jucevičius Ghosh, T. (200
- Page 297 and 298:
Palmira Juceviciene and Vyda Mozuri
- Page 299 and 300:
Palmira Juceviciene and Vyda Mozuri
- Page 301 and 302:
Palmira Juceviciene and Vyda Mozuri
- Page 303 and 304:
Palmira Juceviciene and Vyda Mozuri
- Page 305 and 306:
Palmira Juceviciene and Vyda Mozuri
- Page 307 and 308:
Robertas Jucevicius relations shoul
- Page 309 and 310:
Robertas Jucevicius do not know whe
- Page 311 and 312:
Robertas Jucevicius and innovation
- Page 313 and 314:
Robertas Jucevicius Lawton Smith, H
- Page 315 and 316:
Annukka Jyrämä et al. knowledge c
- Page 317 and 318:
Annukka Jyrämä et al. Respondents
- Page 319 and 320:
Annukka Jyrämä et al. various cit
- Page 321 and 322:
Annukka Jyrämä et al. example hea
- Page 323 and 324:
Managing Information Overload - Tea
- Page 325 and 326:
Harri Ketamo conceptual structure a
- Page 327 and 328:
Harri Ketamo limited to YouTube, Fl
- Page 329 and 330:
Harri Ketamo Figure 8: Visualizatio
- Page 331 and 332:
Farmers’ Knowledge Management in
- Page 333 and 334:
2.1 Farmer knowledge Le Nguyen Doan
- Page 335 and 336:
Le Nguyen Doan Khoi days needed for
- Page 337 and 338:
Le Nguyen Doan Khoi dosage. Moreove
- Page 339 and 340:
Le Nguyen Doan Khoi use homemade in
- Page 341 and 342:
Developing Human Capital through Ne
- Page 343 and 344:
Eric Kong organisation as individua
- Page 345 and 346:
Eric Kong As described by Tosey and
- Page 347 and 348:
Eric Kong Craft, A. (2001) "Neuro-l
- Page 349 and 350:
Sophie Le Bellu and Benoit Le Blanc
- Page 351 and 352:
Sophie Le Bellu and Benoit Le Blanc
- Page 353 and 354:
Results Sophie Le Bellu and Benoit
- Page 355 and 356:
Sophie Le Bellu and Benoit Le Blanc
- Page 357 and 358:
Sophie Le Bellu and Benoit Le Blanc
- Page 359 and 360: Pornpen Lertthasanawong and Nopasit
- Page 361 and 362: Pornpen Lertthasanawong and Nopasit
- Page 363 and 364: Pornpen Lertthasanawong and Nopasit
- Page 365 and 366: Pornpen Lertthasanawong and Nopasit
- Page 367 and 368: 2. Literature review Ya-Hui Ling 2.
- Page 369 and 370: Ya-Hui Ling action of</stro
- Page 371 and 372: Intellectual Capital Intellectual C
- Page 373 and 374: Ya-Hui Ling Hitt, M.A., Hoskisson,
- Page 375 and 376: Maksim Maksimovic et al paper prese
- Page 377 and 378: Maksim Maksimovic et al 4. Lean kno
- Page 379 and 380: Maksim Maksimovic et al of<
- Page 381 and 382: Maurizio Massaro and Andrea Moro <s
- Page 383 and 384: Maurizio Massaro and Andrea Moro Pr
- Page 385 and 386: Maurizio Massaro and Andrea Moro hi
- Page 387 and 388: Maurizio Massaro and Andrea Moro Si
- Page 389 and 390: Helen Mitchell and Dennis Viehland
- Page 391 and 392: Helen Mitchell and Dennis Viehland
- Page 393 and 394: Helen Mitchell and Dennis Viehland
- Page 395 and 396: Helen Mitchell and Dennis Viehland
- Page 397 and 398: Figure 1: KMS Framework for collabo
- Page 399 and 400: Mohd Zali Mohd Nor et al. Ano<stron
- Page 401 and 402: Mohd Zali Mohd Nor et al. Table 4:
- Page 403 and 404: Mohd Zali Mohd Nor et al. KQ8 provi
- Page 405 and 406: Maria Cristina Morariu economy and
- Page 407 and 408: Table 1: Literature review summary
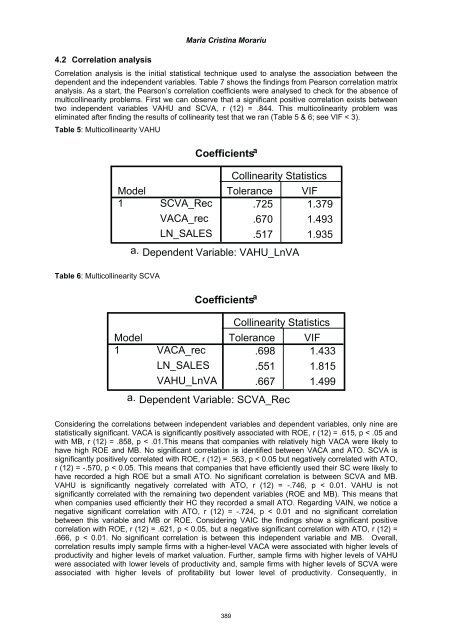
- Page 409: Maria Cristina Morariu ATO = Turnov
- Page 413 and 414: 4.3 Regression analysis Maria Crist
- Page 415 and 416: Table 13: Regression analysis_M6 Mo
- Page 417 and 418: The Arrival of <st
- Page 419 and 420: Bertrand Pauget and Ahmed Dammak Mo
- Page 421 and 422: Bertrand Pauget and Ahmed Dammak no
- Page 423 and 424: Bertrand Pauget and Ahmed Dammak th
- Page 425 and 426: Bertrand Pauget and Ahmed Dammak Sa
- Page 427 and 428: Wannapa Pipattanawong et al. cannot
- Page 429 and 430: Wannapa Pipattanawong et al. 3.2 Do
- Page 431 and 432: Wannapa Pipattanawong et al. Moreov
- Page 433 and 434: The Dark Side of S
- Page 435 and 436: Siwarit Pongsakornrungsilp vans, ro
- Page 437 and 438: Siwarit Pongsakornrungsilp Kreng Ja
- Page 439: Siwarit Pongsakornrungsilp Lave, J.