- Page 2 and 3:
Acknowledgements This study was con
- Page 4 and 5:
Contents Recycling Treated Municipa
- Page 6 and 7:
Contents Recycling Treated Municipa
- Page 8 and 9:
Executive Summary Vision Executive
- Page 10 and 11:
Section 1: Introduction 1.1 Project
- Page 12 and 13:
Table 1.2. Water Use in Minnesota,
- Page 14 and 15:
Section 1: Introduction Recycling T
- Page 16 and 17:
1.5 Summary Section 1: Introduction
- Page 18 and 19:
Section 2: Recycled Wastewater Dema
- Page 20 and 21:
Section 2: Recycled Wastewater Dema
- Page 23 and 24:
Section 2: Recycled Wastewater Dema
- Page 26 and 27:
Figure 2.9. Ground Water Contaminat
- Page 28:
Section 2: Recycled Wastewater Dema
- Page 31:
Section 2: Recycled Wastewater Dema
- Page 35 and 36:
Section 2: Recycled Wastewater Dema
- Page 38 and 39:
Table 2.8. Ethanol Plant Capacity a
- Page 40 and 41:
Section 2: Recycled Wastewater Dema
- Page 42 and 43:
2.7 References Section 2: Recycled
- Page 44 and 45:
Section 3: Recycled Wastewater Syst
- Page 46 and 47:
Water Quality Overview The total co
- Page 48 and 49:
Industrial Water Quality Concerns S
- Page 50 and 51:
Emerging Contaminants of Concern Se
- Page 52 and 53:
Section 3: Recycled Wastewater Syst
- Page 54 and 55:
Section 3: Recycled Wastewater Syst
- Page 56 and 57:
3.4 Storage and Transmission Overvi
- Page 58 and 59:
Section 3: Recycled Wastewater Syst
- Page 60 and 61:
Cost by Standard Industry Categorie
- Page 62 and 63:
Costs and Planning Considerations S
- Page 64 and 65:
Section 4: Implementation Considera
- Page 66 and 67:
Economic Incentives and Risk Assess
- Page 68 and 69:
Section 5: Summary and Potential Ne
- Page 70 and 71: Long-Term Vision Section 5: Summary
- Page 72: Exhibit A: California Water Recycli
- Page 75 and 76: Metropolitan Council Recycling Trea
- Page 77 and 78: Contents Section 1 - Introduction C
- Page 79 and 80: Craddock Consulting Engineers In As
- Page 81 and 82: Section 1 Introduction Craddock Con
- Page 83 and 84: Section 1 Introduction Craddock Con
- Page 85 and 86: Section 1 Introduction Craddock Con
- Page 87 and 88: Craddock Consulting Engineers 2-1 I
- Page 89 and 90: Section 2 Implementation Considerat
- Page 91 and 92: Section 2 Implementation Considerat
- Page 93 and 94: Section 2 Implementation Considerat
- Page 95 and 96: Table 2.4. Examples of State Water
- Page 97 and 98: Section 2 Implementation Considerat
- Page 99 and 100: Section 2 Implementation Considerat
- Page 101 and 102: Section 2 Implementation Considerat
- Page 103 and 104: Section 2 Implementation Considerat
- Page 105 and 106: Section 2 Implementation Considerat
- Page 107 and 108: Section 2 Implementation Considerat
- Page 109: Section 2 Implementation Considerat
- Page 112 and 113: Section 2 Implementation Considerat
- Page 114 and 115: Section 2 Implementation Considerat
- Page 116 and 117: Section 2 Implementation Considerat
- Page 118 and 119: Craddock Consulting Engineers 3-1 I
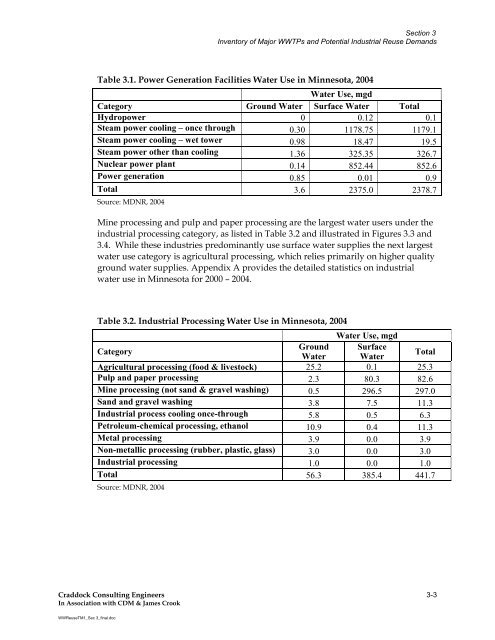
- Page 122 and 123: Section 3 Inventory of Major WWTPs
- Page 124 and 125: Figure 3.6. Industrial Reuse Custom
- Page 126 and 127: Section 3 Inventory of Major WWTPs
- Page 128 and 129: Figure 3.7b. Ground Water Availabil
- Page 130 and 131: Section 3 Inventory of Major WWTPs
- Page 132 and 133: ") Figure 3.8c. Cedar River Watersh
- Page 134 and 135: Section 3 Inventory of Major WWTPs
- Page 136 and 137: Section 3 Inventory of Major WWTPs
- Page 138 and 139: Section 3 Inventory of Major WWTPs
- Page 140 and 141: ") ") ") ") Figure 3.10c. Lower Mis
- Page 142 and 143: Section 3 Inventory of Major WWTPs
- Page 144 and 145: Section 3 Inventory of Major WWTPs
- Page 146 and 147: Section 3 Inventory of Major WWTPs
- Page 148 and 149: Section 3 Inventory of Major WWTPs
- Page 150 and 151: Section 3 Inventory of Major WWTPs
- Page 152 and 153: Figure 3.12c. Mississippi River - H
- Page 154 and 155: Section 3 Inventory of Major WWTPs
- Page 156 and 157: Section 3 Inventory of Major WWTPs
- Page 158 and 159: Figure 3.14b. Rainy River Watershed
- Page 160 and 161: Section 3 Inventory of Major WWTPs
- Page 162 and 163: Section 3 Inventory of Major WWTPs
- Page 164 and 165: Section 3 Inventory of Major WWTPs
- Page 166 and 167: ") Figure 3.16c. St. Croix River Wa
- Page 168 and 169: Section 3 Inventory of Major WWTPs
- Page 170 and 171:
Section 3 Inventory of Major WWTPs
- Page 172 and 173:
Section 3 Inventory of Major WWTPs
- Page 174 and 175:
Figure 3.18 Metro Area Industrial R
- Page 176 and 177:
Section 3 Inventory of Major WWTPs
- Page 178 and 179:
G G Flying Cloud Dr !! G! G Figure
- Page 180 and 181:
Section 3 Inventory of Major WWTPs
- Page 182 and 183:
Figure 3.22. Rogers WWTP - Industri
- Page 184 and 185:
Section 3 Inventory of Major WWTPs
- Page 186 and 187:
G G G! Dodd Rd GG Figure 3.24. Rose
- Page 188 and 189:
Section 3 Inventory of Major WWTPs
- Page 190 and 191:
G Figure 3.26. Hastings WWTP - Indu
- Page 192 and 193:
State Hwy 36 ! Figure 3.28. St. Cro
- Page 194 and 195:
Section 3 Inventory of Major WWTPs
- Page 196 and 197:
Section 3 Inventory of Major WWTPs
- Page 198 and 199:
Craddock Consulting Engineers In As
- Page 200 and 201:
Water Use Code Categories Minnesota
- Page 202 and 203:
Minnesota Water Use for All Categor
- Page 204 and 205:
Air Conditioning 0.2% Waterworks 15
- Page 206 and 207:
Minnesota Water Use, 2000-2004 - St
- Page 208 and 209:
Minnesota Water Use in 2004 (withou
- Page 210 and 211:
Minnesota Water Use in 2000 (withou
- Page 212 and 213:
UseCode by Year Minnesota Power Gen
- Page 214 and 215:
Water Use (MGD) Water Use (MGD) 350
- Page 216 and 217:
Minnesota Industrial Processing Fac
- Page 218 and 219:
Minnesota Industrial Processing Fac
- Page 220 and 221:
Water Use (MGD) Water Use (MGD) 120
- Page 222 and 223:
Water Use (MGD) Water Use (MGD) 13.
- Page 224 and 225:
Craddock Consulting Engineers In As
- Page 226 and 227:
Overview There are no federal regul
- Page 228 and 229:
Appendix B Status of Water Reuse Re
- Page 230 and 231:
Appendix B Status of Water Reuse Re
- Page 232 and 233:
Table 4. Examples of State Water Re
- Page 234 and 235:
Appendix B Status of Water Reuse Re
- Page 236 and 237:
Appendix B Status of Water Reuse Re
- Page 238 and 239:
Setback Distances Appendix B Status
- Page 240 and 241:
Appendix B Status of Water Reuse Re
- Page 242 and 243:
Appendix B Status of Water Reuse Re
- Page 244 and 245:
Appendix B Status of Water Reuse Re
- Page 246 and 247:
Craddock Consulting Engineers In As
- Page 248 and 249:
WATER USE (MGD) WATER USE (MGD) 3.5
- Page 250 and 251:
Table 3.9a. Industrial Water Use in
- Page 252 and 253:
Table 3.10a. Industrial Water Use i
- Page 254 and 255:
Table 3.10d. Industries in the Lowe
- Page 256 and 257:
WATER USE (MGD) WATER USE (MGD) 8 7
- Page 258 and 259:
Table 3.11d. Industries in the Minn
- Page 260 and 261:
Table 3.11d. Industries in the Minn
- Page 262 and 263:
WATER USE (MGD) WATER USE (MGD) 12
- Page 264 and 265:
Table 3.12c. Industries in the Miss
- Page 266 and 267:
Table 3.12c. Industries in the Miss
- Page 268 and 269:
Table 3.12c. Industries in the Miss
- Page 270 and 271:
Table 3.12c. Industries in the Miss
- Page 272 and 273:
Table 3.13a. Industrial Water Use i
- Page 274 and 275:
Table 3.14a. Industrial Water Use i
- Page 276 and 277:
Table 3.15a. Industrial Water Use i
- Page 278 and 279:
WATER USE (MGD) WATER USE (MGD) 2.5
- Page 280 and 281:
WATER USE (MGD) WATER USE (MGD) 0.8
- Page 282 and 283:
Table 3.17c. Industries in the West
- Page 284 and 285:
MN Permit No Facility Minnesota Mun
- Page 286 and 287:
MN Permit No Facility Minnesota Mun
- Page 288 and 289:
Craddock Consulting Engineers In As
- Page 290:
Minnesota DNR Waters 2005 Ground-wa
- Page 294 and 295:
Craddock Consulting Engineers In As
- Page 296 and 297:
Permit No. Organization NAICS Code
- Page 298 and 299:
Permit No. Organization NAICS Code
- Page 300 and 301:
Permit No. Organization NAICS Code
- Page 302 and 303:
Permit No. Organization NAICS Code
- Page 304 and 305:
Permit No. Organization NAICS Code
- Page 306 and 307:
Permit No. Organization NAICS Code
- Page 308 and 309:
Permit No. Organization NAICS Code
- Page 310 and 311:
Metropolitan Council Recycling Trea
- Page 312 and 313:
TM2: Sampling Plan and Results Recy
- Page 314 and 315:
TM2: Sampling Plan and Results Recy
- Page 316 and 317:
TM2: Sampling Plan and Results Recy
- Page 318 and 319:
TM2: Sampling Plan and Results Recy
- Page 320 and 321:
TM2: Sampling Plan and Results Recy
- Page 322 and 323:
TM2: Sampling Plan and Results Recy
- Page 324 and 325:
TM2: Sampling Plan and Results Recy
- Page 326 and 327:
Recommended Limits for Various Indu
- Page 328:
Exhibit B Blue Lake WWTP Sampling R
- Page 331 and 332:
MCES Blue Lake Plant Final Effluent
- Page 333 and 334:
Date Day of Wk MCES Blue Lake Plant
- Page 335 and 336:
Date Day of Wk MCES Blue Lake Plant
- Page 337 and 338:
Date Day of Wk MCES Blue Lake Plant
- Page 340 and 341:
MCES Empire Plant Final Effluent Sa
- Page 342 and 343:
Date Day of Wk 10/24/06 Tuesday 10/
- Page 344 and 345:
Date Day of Wk 10/24/06 Tuesday 10/
- Page 346 and 347:
Date Day of Wk 10/24/06 Tuesday 10/
- Page 348 and 349:
Exhibit D Metropolitan (Metro) WWTP
- Page 350 and 351:
MCES Metropolitan Plant Final Efflu
- Page 352 and 353:
Date Day of Wk 4/19/07 Thursday 4/2
- Page 354 and 355:
Date Day of Wk 4/19/07 Thursday 4/2
- Page 356 and 357:
Date Day of Wk 4/19/07 Thursday 4/2
- Page 358 and 359:
MCES Seneca Plant Final Effluent Sa
- Page 360 and 361:
Date Day of Wk 10/8/06 Sunday 10/9/
- Page 362 and 363:
Date Day of Wk 10/8/06 Sunday 10/9/
- Page 364 and 365:
Date Day of Wk 10/8/06 Sunday 10/9/
- Page 366 and 367:
Metropolitan Council Recycling Trea
- Page 368 and 369:
Section 5 - Costs Table of Contents
- Page 370 and 371:
TM3: Recycled Wastewater System Com
- Page 372 and 373:
TM3: Recycled Wastewater System Com
- Page 374 and 375:
WWTP 1 - 2 - 3 - 4 - 5 - 1 Treatmen
- Page 376 and 377:
TM3: Recycled Wastewater System Com
- Page 378 and 379:
TM3: Recycled Wastewater System Com
- Page 380 and 381:
TM3: Recycled Wastewater System Com
- Page 382:
o Synthetic medium o Two-stage Surf
- Page 385 and 386:
TM3: Recycled Wastewater System Com
- Page 387 and 388:
TM3: Recycled Wastewater System Com
- Page 389 and 390:
TM3: Recycled Wastewater System Com
- Page 391 and 392:
TM3: Recycled Wastewater System Com
- Page 393 and 394:
TM3: Recycled Wastewater System Com
- Page 395 and 396:
TM3: Recycled Wastewater System Com
- Page 397 and 398:
TM3: Recycled Wastewater System Com
- Page 399 and 400:
TM3: Recycled Wastewater System Com
- Page 401 and 402:
TM3: Recycled Wastewater System Com
- Page 403 and 404:
Table 13 WATER REUSE SYSTEM COST OF
- Page 405 and 406:
TM3: Recycled Wastewater System Com
- Page 407 and 408:
TM3: Recycled Wastewater System Com
- Page 409 and 410:
Cost of Service, $/1000 gallon 1.00
- Page 411 and 412:
TM3: Recycled Wastewater System Com
- Page 413 and 414:
TM3: Recycled Wastewater System Com
- Page 415 and 416:
TM3: Recycled Wastewater System Com
- Page 417 and 418:
TM3: Recycled Wastewater System Com
- Page 419 and 420:
Cost of Service, $/1000 gallons 8.0
- Page 421 and 422:
TM3: Recycled Wastewater System Com
- Page 423 and 424:
Appendix A Water Reuse Regulatory E
- Page 425 and 426:
Table A-1. 2000 California Water Re
- Page 427 and 428:
California Department of Health Ser
- Page 429 and 430:
Other Media Type Filters Fuzzy Filt
- Page 431 and 432:
Appendix B TECHNICAL MEMORANDUM Rec
- Page 433 and 434:
Appendix B Reclaimed Water Transmis
- Page 435 and 436:
Exhibit 1 Transmission Main Cost To
- Page 437 and 438:
Pipe Installation Data (DR 18 PVC P
- Page 439 and 440:
Equipment Costs (with O&P) Item Des
- Page 441 and 442:
Water Reuse Pipe Line Construction
- Page 443 and 444:
Construction Unit Costs Item (2006
- Page 445 and 446:
Crew Costs (with O&P) St. Paul Pres
- Page 447 and 448:
Capital PROJECT Cost Curves for Rec
- Page 449 and 450:
Diam (in) Annual Average Day Flow A
- Page 451 and 452:
Diam (in) Annual Average Day Flow A
- Page 453 and 454:
Pipe Capital Project Cost, $ Millio
- Page 455 and 456:
Pipe Capital Project Cost, $/1000 g
- Page 457 and 458:
Capital PROJECT Cost Curves for Rec
- Page 459 and 460:
Capital PROJECT Cost Curves for Rec
- Page 461 and 462:
Annual Pipe Average Annual Velocity
- Page 463 and 464:
Pipe Capital Project Cost, $ Millio
- Page 465 and 466:
Exhibit 3 Water Reuse System O&M Co
- Page 467 and 468:
Diam (in) Annual Average Day Flow (
- Page 469 and 470:
Diam (in) Annual Average Day Flow (
- Page 471 and 472:
Diam (in) Annual Average Day Flow (
- Page 473 and 474:
Diam (in) Annual Average Day Flow (
- Page 475 and 476:
Pumping Cost, $/1000 gallons 0.095
- Page 477 and 478:
Water Reuse System Estimated Cost o
- Page 479 and 480:
WATER REUSE SYSTEM COST OF SERVICE
- Page 481 and 482:
WATER REUSE SYSTEM COST OF SERVICE
- Page 483 and 484:
WATER REUSE SYSTEM COST OF SERVICE
- Page 485 and 486:
WATER REUSE SYSTEM COST OF SERVICE
- Page 487 and 488:
WATER REUSE SYSTEM COST OF SERVICE
- Page 489 and 490:
Appendix D-1 Water Reuse System Cos
- Page 491 and 492:
Water Reuse System Estimates of Pro
- Page 493 and 494:
Cost of Service, $/1000 gallon 2.00
- Page 495 and 496:
Cost Curves as Basis for Tertiary 1
- Page 497 and 498:
Cost Curves as Basis for Tertiary 1
- Page 499 and 500:
Water Reuse System Estimated Cost o
- Page 501 and 502:
Cost of Service, $/1000 gallon 10.0
- Page 503 and 504:
Cost Curves as Basis for Tertiary 2
- Page 505 and 506:
Appendix D-3 Water Reuse System Cos
- Page 507 and 508:
Water Reuse System Estimates of Pro
- Page 509 and 510:
Cost of Service, $/1000 gallon 5.00
- Page 511 and 512:
Cost Curves as Basis for Tertiary 3
- Page 513 and 514:
Water Reuse System Estimated Cost o
- Page 515 and 516:
Cost of Service, $/1000 gallon 10.0
- Page 517 and 518:
Cost Curves as Basis for Tertiary 4
- Page 519 and 520:
Appendix D-5 Water Reuse System Cos
- Page 521 and 522:
Water Reuse System Estimates of Pro
- Page 523 and 524:
Cost of Service, $/1000 gallon 5.00
- Page 525 and 526:
Appendix D-6 Water Reuse System Cos
- Page 527 and 528:
Water Reuse System Estimates of Pro
- Page 529 and 530:
Cost of Service, $/1000 gallon 5.00
- Page 531 and 532:
Cost Curves as Basis for Tertiary 4
- Page 533 and 534:
Secondary Treatment Assumptions Sus
- Page 535 and 536:
Secondary Treatment Assumptions Sus
- Page 537 and 538:
Secondary Treatment Assumptions Sus
- Page 539 and 540:
Secondary Treatment Assumptions Sus
- Page 541 and 542:
Craddock Consulting Engineers 1 In
- Page 543 and 544:
TM4: WWTP Effluent Quality Recyclin
- Page 545 and 546:
!( !( !( !( !( !( !( !( !( !( !( !(
- Page 547 and 548:
TM4: WWTP Effluent Quality Recyclin
- Page 549 and 550:
Frequency of Occurrence, % Frequenc
- Page 551 and 552:
No. of Plants Total Permitting Desi
- Page 553 and 554:
TM4: WWTP Effluent Quality Recyclin
- Page 555 and 556:
!( !( !( !( !( !( !( !( !( !( !( !(
- Page 557 and 558:
TM4: WWTP Effluent Quality Recyclin
- Page 559 and 560:
Frequency of Occurrence, % Frequenc
- Page 561 and 562:
No. of Plants Total Permitting Desi
- Page 563 and 564:
TM4: WWTP Effluent Quality Recyclin
- Page 565 and 566:
!( !( !( !( !( !( !( !( !( !( !( !(
- Page 567 and 568:
TM4: WWTP Effluent Quality Recyclin
- Page 569 and 570:
Craddock Consulting Engineers 1 In
- Page 571 and 572:
1.0 Introduction This technical mem
- Page 573 and 574:
Exhibit A Regulatory Stakeholder Me
- Page 575 and 576:
MCES Recycling Treated Wastewater f
- Page 577 and 578:
MCES Recycling Treated Wastewater f
- Page 579 and 580:
Municipal Wastewater Reuse Regulato
- Page 581 and 582:
MCES Recycling Treated Wastewater f
- Page 583 and 584:
Exhibit B Industry Stakeholder Meet
- Page 585 and 586:
Recycling Treated Wastewater For In
- Page 587 and 588:
Institutional Issues Topic Discussi
- Page 589 and 590:
Institutional Issues Topic Discussi
- Page 591 and 592:
Recycling Treated Wastewater For In
- Page 593 and 594:
Recycling Treated Wastewater For In
- Page 595 and 596:
Recycling Treated Wastewater For In
- Page 597 and 598:
Recycling Treated Wastewater For In
- Page 599 and 600:
Exhibit C Broader Base Stakeholder
- Page 601 and 602:
Recycling Treated Wastewater For In
- Page 603 and 604:
Recycling Treated Wastewater For In
- Page 605 and 606:
Recycling Treated Wastewater For In
- Page 607 and 608:
Recycling Treated Wastewater For In
- Page 609 and 610:
Recycling Treated Wastewater For In
- Page 611 and 612:
Recycling Treated Wastewater For In