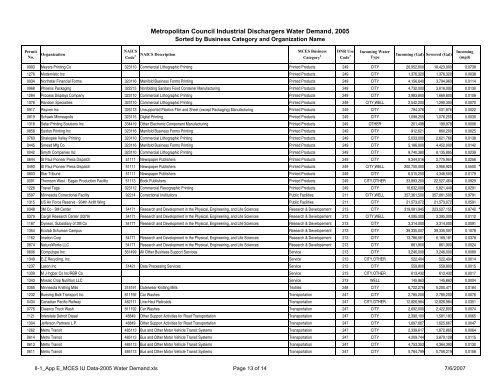
Permit No. Organization NAICS Code 1 Metropolitan Council <strong>Industrial</strong> Dischargers <strong>Water</strong> Demand, 2005 Sorted by Business Category and Organization Name NAICS Description MCES Business Category 2 DNR <strong>Use</strong> Code 3 Incoming <strong>Water</strong> Type Incoming (Gal) Sewered (Gal) 0993 Meyers Printing Co 323110 Commercial Lithographic Printing Printed Products 249 CITY 26,952,600 18,423,900 0.0738 1276 Modernistic Inc Printed Products 249 CITY 1,376,320 1,376,320 0.0038 0934 Northstar Financial Forms 323116 Manifold Business Forms Printing Printed Products 249 CITY 4,156,640 3,794,960 0.0114 0968 Phoenix Packaging 322215 Nonfolding Sanitary Food Container Manufacturing Printed Products 249 CITY 4,732,000 3,616,000 0.0130 1284 Process Displays Company 323110 Commercial Lithographic Printing Printed Products 249 CITY 3,983,800 1,669,800 0.0109 1076 Random Specialties 323110 Commercial Lithographic Printing Printed Products 249 CITY,WELL 2,542,200 1,290,300 0.0070 0917 Rayven Inc 326113 Unsupported Plastics Film and Sheet (except Packaging) Manufacturing Printed Products 249 CITY 794,376 531,876 0.0022 0819 Schawk Minneapolis 323115 Digital Printing Printed Products 249 CITY 1,098,255 1,076,255 0.0030 1318 Sefar Printing Solutions Inc. 334419 Other Electronic Component Manufacturing Printed Products 249 OTHER 201,498 199,978 0.0006 0858 Sexton Printing Inc 323116 Manifold Business Forms Printing Printed Products 249 CITY 912,621 860,200 0.0025 0760 Shakopee Valley Printing 323110 Commercial Lithographic Printing Printed Products 249 CITY 5,033,000 2,621,766 0.0138 0445 Smead Mfg Co 323116 Manifold Business Forms Printing Printed Products 249 CITY 5,186,000 4,452,000 0.0142 0042 Smyth Companies Inc 323110 Commercial Lithographic Printing Printed Products 249 CITY 8,740,380 8,135,895 0.0239 0644 St Paul Pioneer Press Dispatch 51111 Newspaper Publishers Printed Products 249 CITY 9,344,016 2,775,954 0.0256 0493 St Paul Pioneer Press Dispatch 51111 Newspaper Publishers Printed Products 249 CITY,WELL 200,750,000 3,956,920 0.5500 * 0803 Star Tribune 51111 Newspaper Publishers Printed Products 249 CITY 6,515,250 4,348,500 0.0179 0091 Thomson West - Eagan Production Facility 51113 Book Publishers Printed Products 249 CITY,OTHER 33,893,200 22,527,464 0.0929 1226 Travel Tags 323112 Commercial Flexographic Printing Printed Products 249 CITY 10,632,000 5,821,440 0.0291 0597 Minnesota Correctional Facility 92214 Correctional Institutions Public Facilities 211 CITY,WELL 357,361,500 357,061,500 0.9791 1315 US Air Force Reserve - 934th Airlift Wing Public Facilities 211 CITY 21,573,072 21,573,072 0.0591 0348 3M Co - 3M Center 54171 Research and Development in the Physical, Engineering, and Life Sciences Research & Developement 213 CITY 319,081,945 223,527,155 0.8742 * 0379 Cargill Research Center (0379) 54171 Research and Development in the Physical, Engineering, and Life Sciences Research & Developement 213 CITY,WELL 4,095,000 3,395,000 0.0112 1187 Dyneon, Subsidiary of 3M Co 54171 Research and Development in the Physical, Engineering, and Life Sciences Research & Developement 213 CITY 3,314,000 3,314,000 0.0091 1354 Ecolab Schuman Campus Research & Developement 213 CITY 39,335,007 39,335,007 0.1078 1162 Imation Corp 54171 Research and Development in the Physical, Engineering, and Life Sciences Research & Developement 213 CITY 13,786,561 6,169,181 0.0378 0874 NatureWorks LLC 54171 Research and Development in the Physical, Engineering, and Life Sciences Research & Developement 213 CITY 861,900 861,900 0.0024 0606 Computype Inc 561499 All Other Business Support Services Service 213 CITY 3,246,000 3,246,000 0.0089 1349 E-Z <strong>Recycling</strong>, Inc. Service 213 CITY,OTHER 522,404 522,404 0.0014 1237 Lason Inc 51421 Data Processing Services Service 213 CITY 559,800 559,800 0.0015 1339 M J Ingber Co Inc/RBR Co Service 213 CITY,OTHER 613,432 613,432 0.0017 1343 Mosaic Crop Nutrition LLC Service 213 WELL 145,863 145,863 0.0004 0355 Minnesota Knitting Mills 315191 Outerwear Knitting Mills Textiles 248 CITY 6,722,276 5,200,471 0.0184 1232 Buesing Bulk Transport Inc 811192 Car Washes Transportation 247 CITY 2,785,200 2,785,200 0.0076 0434 Canadian Pacific Railway 482111 Line-Haul Railroads Transportation 247 CITY,OTHER 12,826,984 12,826,984 0.0351 0776 Cleanco Truck Wash 811192 Car Washes Transportation 247 CITY 2,692,000 2,422,800 0.0074 1121 Interstate Detroit Diesel 48849 Other Support Activities <strong>for</strong> Road Transportation Transportation 247 CITY 2,390,100 1,581,183 0.0065 1304 Jefferson Partners L P 48849 Other Support Activities <strong>for</strong> Road Transportation Transportation 247 CITY 1,697,667 1,625,667 0.0047 1262 Metro Transit 485113 Bus and Other Motor Vehicle Transit Systems Transportation 247 CITY 2,339,617 1,872,865 0.0064 0614 Metro Transit 485113 Bus and Other Motor Vehicle Transit Systems Transportation 247 CITY 4,209,744 3,879,128 0.0115 0613 Metro Transit 485113 Bus and Other Motor Vehicle Transit Systems Transportation 247 CITY 4,753,353 4,364,393 0.0130 0611 Metro Transit 485113 Bus and Other Motor Vehicle Transit Systems Transportation 247 CITY 5,764,799 5,756,219 0.0158 II-1_App E_MCES IU Data-2005 <strong>Water</strong> Demand.xls Page 13 of 14 7/6/2007 Incoming (mgd)
Permit No. Organization NAICS Code 1 Metropolitan Council <strong>Industrial</strong> Dischargers <strong>Water</strong> Demand, 2005 Sorted by Business Category and Organization Name NAICS Description MCES Business Category 2 DNR <strong>Use</strong> Code 3 Incoming <strong>Water</strong> Type Incoming (Gal) Sewered (Gal) 0615 Metro Transit 485113 Bus and Other Motor Vehicle Transit Systems Transportation 247 CITY 6,902,120 6,124,200 0.0189 0616 Metro Transit 485113 Bus and Other Motor Vehicle Transit Systems Transportation 247 CITY 9,273,928 8,654,023 0.0254 1000 Metropolitan Airports Commission 48819 Other Support Activities <strong>for</strong> Air Transportation Transportation 247 13,487,344 0.0000 0200 Northwest Airlines Inc (MB) 200 48819 Other Support Activities <strong>for</strong> Air Transportation Transportation 247 WELL 216,470,888 286,339,144 0.5931 0050 Northwest Airlines Inc (OB) 334412 Bare Printed Circuit Board Manufacturing Transportation 247 CITY 109,024,592 89,277,556 0.2987 1062 Penske Truck Leasing Co 53212 Truck, Utility Trailer, and RV (Recreational Vehicle) Rental and Leasing Transportation 247 CITY 804,000 804,000 0.0022 0975 Servisair & Shell Fuel Services 48819 Other Support Activities <strong>for</strong> Air Transportation Transportation 247 CITY,OTHER 2,460,688 2,460,688 0.0067 1316 South St Paul Truck Wash 562998 All Other Miscellaneous Waste Management Services Transportation 247 CITY 7,050,000 7,050,000 0.0193 0003 The BNSF Railway Co 482111 Line-Haul Railroads Transportation 247 CITY,OTHER 24,321,000 9,684,900 0.0666 0979 Upper River Services Inc 483211 Inland <strong>Water</strong> Freight Transportation Transportation 247 WELL,OTHER 1,261,300 1,199,650 0.0035 0015 Upper River Services Inc 483211 Inland <strong>Water</strong> Freight Transportation Transportation 247 OTHER 4,483,509 4,178,130 0.0123 1320 Wayne Transports Inc Transportation 247 CITY,WELL 10,751,662 10,751,662 0.0295 0887 City of Apple Valley (0887) 22131 <strong>Water</strong> Supply and Irrigation Systems Utilities 211 WELL 4,679,914,000 4,786,600 12.8217 1222 City of Champlin (1222) 22131 <strong>Water</strong> Supply and Irrigation Systems Utilities 211 WELL 4,738,640,000 11,650,800 12.9826 0985 City of Eagan (0985) 22131 <strong>Water</strong> Supply and Irrigation Systems Utilities 211 CITY 18,951,018,000 63,936,000 51.9206 0984 City of Edina (0984) 22131 <strong>Water</strong> Supply and Irrigation Systems Utilities 211 CITY 3,342,954,000 11,691,600 9.1588 0852 City of Fridley (0852) 22131 <strong>Water</strong> Supply and Irrigation Systems Utilities 211 WELL 1,204,423,000 12,664,975 3.2998 0959 City of New Brighton (0959) 22131 <strong>Water</strong> Supply and Irrigation Systems Utilities 211 WELL 10,491,344,000 53,768,000 28.7434 1006 City of Orono (1006) 22131 <strong>Water</strong> Supply and Irrigation Systems Utilities 211 WELL 280,296,000 2,241,600 0.7679 0709 City of St Louis Park (0709) 22131 <strong>Water</strong> Supply and Irrigation Systems Utilities 211 WELL 2,229,384,000 2,403,000 6.1079 1016 City of St Louis Park (1016) 22131 <strong>Water</strong> Supply and Irrigation Systems Utilities 211 WELL 114,877,340 348,000 0.3147 1172 Foster Wheeler Twin Cities Inc 61131 Colleges, Universities, and Professional Schools Utilities 211 CITY 50,976,000 26,502,000 0.1397 0922 Minneapolis <strong>Water</strong> Works 22131 <strong>Water</strong> Supply and Irrigation Systems Utilities 211 OTHER 22,618,000,000 1,639,500 61.9671 0018 Robbinsdale 22131 <strong>Water</strong> Supply and Irrigation Systems Utilities 211 CITY 4,510,000 4,510,000 0.0124 0576 NSP, dba Xcel Energy (0576) 221112 Fossil Fuel Electric Power Generation Utilities-Power 229 CITY,WELL 322,278,339 73,429,761 0.8830 0824 NSP, dba Xcel Energy (0824) 221112 Fossil Fuel Electric Power Generation Utilities-Power 229 CITY 1,098,149 456,420 0.0030 1324 St Paul Cogeneration LLC Utilities-Power 229 CITY,WELL 265,064,032 92,240,086 0.7262 0770 Covanta Hennepin Energy Resource Co LP 562213 Solid Waste Combustors and Incinerators Utilities-Steam&AirCond 230 CITY 1,220,870,232 16,816,812 3.3448 0474 District Energy St Paul Inc 22133 Steam and Air-Conditioning Supply Utilities-Steam&AirCond 230 CITY 99,472,496 13,422,776 0.2725 1057 Foster Wheeler Twin Cities Inc 22133 Steam and Air-Conditioning Supply Utilities-Steam&AirCond 230 CITY 19,138,000 13,126,000 0.0524 1236 Hennepin County Energy Center 22133 Steam and Air-Conditioning Supply Utilities-Steam&AirCond 230 CITY 44,004,029 10,327,341 0.1206 1241 NRG Energy Center Minneapolis LLC 22133 Steam and Air-Conditioning Supply Utilities-Steam&AirCond 230 CITY 8,387,806 1,591,125 0.0230 0900 NRG Energy Center Minneapolis LLC 22133 Steam and Air-Conditioning Supply Utilities-Steam&AirCond 230 CITY 16,460,068 2,136,750 0.0451 1240 NRG Energy Center Minneapolis LLC 22133 Steam and Air-Conditioning Supply Utilities-Steam&AirCond 230 CITY 20,381,591 4,708,391 0.0558 0603 NRG Energy Center Minneapolis LLC 22133 Steam and Air-Conditioning Supply Utilities-Steam&AirCond 230 CITY,WELL 150,910,825 39,227,540 0.4135 1 North American Industry Classification System (NAICS) code system category <strong>for</strong> each industrial discharger 2 Business or industry categories established by Metropolit Council Environmental Services 3 <strong>Water</strong> use code established by Minnesota DNR and assigned to MCES <strong>Industrial</strong> Discharge permittees to view both databases under one classification system *Incoming water (gallons) reported to MCES with permit in<strong>for</strong>mation was different than reported in the Industry <strong>Water</strong> <strong>Use</strong> Survey conducted <strong>for</strong> the <strong>Recycling</strong> <strong>Treated</strong> <strong>Municipal</strong> <strong>Wastewater</strong> <strong>for</strong> <strong>Industrial</strong> <strong>Water</strong> <strong>Use</strong> project. This table lists the value reported in the survey, which in some cases is not consistent with the value recorded <strong>for</strong> "Sewered". Further use of the in<strong>for</strong>mation should be verified with the industry and MCES. II-1_App E_MCES IU Data-2005 <strong>Water</strong> Demand.xls Page 14 of 14 7/6/2007 Incoming (mgd)
- Page 2 and 3:
Acknowledgements This study was con
- Page 4 and 5:
Contents Recycling Treated Municipa
- Page 6 and 7:
Contents Recycling Treated Municipa
- Page 8 and 9:
Executive Summary Vision Executive
- Page 10 and 11:
Section 1: Introduction 1.1 Project
- Page 12 and 13:
Table 1.2. Water Use in Minnesota,
- Page 14 and 15:
Section 1: Introduction Recycling T
- Page 16 and 17:
1.5 Summary Section 1: Introduction
- Page 18 and 19:
Section 2: Recycled Wastewater Dema
- Page 20 and 21:
Section 2: Recycled Wastewater Dema
- Page 23 and 24:
Section 2: Recycled Wastewater Dema
- Page 26 and 27:
Figure 2.9. Ground Water Contaminat
- Page 28:
Section 2: Recycled Wastewater Dema
- Page 31:
Section 2: Recycled Wastewater Dema
- Page 35 and 36:
Section 2: Recycled Wastewater Dema
- Page 38 and 39:
Table 2.8. Ethanol Plant Capacity a
- Page 40 and 41:
Section 2: Recycled Wastewater Dema
- Page 42 and 43:
2.7 References Section 2: Recycled
- Page 44 and 45:
Section 3: Recycled Wastewater Syst
- Page 46 and 47:
Water Quality Overview The total co
- Page 48 and 49:
Industrial Water Quality Concerns S
- Page 50 and 51:
Emerging Contaminants of Concern Se
- Page 52 and 53:
Section 3: Recycled Wastewater Syst
- Page 54 and 55:
Section 3: Recycled Wastewater Syst
- Page 56 and 57:
3.4 Storage and Transmission Overvi
- Page 58 and 59:
Section 3: Recycled Wastewater Syst
- Page 60 and 61:
Cost by Standard Industry Categorie
- Page 62 and 63:
Costs and Planning Considerations S
- Page 64 and 65:
Section 4: Implementation Considera
- Page 66 and 67:
Economic Incentives and Risk Assess
- Page 68 and 69:
Section 5: Summary and Potential Ne
- Page 70 and 71:
Long-Term Vision Section 5: Summary
- Page 72:
Exhibit A: California Water Recycli
- Page 75 and 76:
Metropolitan Council Recycling Trea
- Page 77 and 78:
Contents Section 1 - Introduction C
- Page 79 and 80:
Craddock Consulting Engineers In As
- Page 81 and 82:
Section 1 Introduction Craddock Con
- Page 83 and 84:
Section 1 Introduction Craddock Con
- Page 85 and 86:
Section 1 Introduction Craddock Con
- Page 87 and 88:
Craddock Consulting Engineers 2-1 I
- Page 89 and 90:
Section 2 Implementation Considerat
- Page 91 and 92:
Section 2 Implementation Considerat
- Page 93 and 94:
Section 2 Implementation Considerat
- Page 95 and 96:
Table 2.4. Examples of State Water
- Page 97 and 98:
Section 2 Implementation Considerat
- Page 99 and 100:
Section 2 Implementation Considerat
- Page 101 and 102:
Section 2 Implementation Considerat
- Page 103 and 104:
Section 2 Implementation Considerat
- Page 105 and 106:
Section 2 Implementation Considerat
- Page 107 and 108:
Section 2 Implementation Considerat
- Page 109:
Section 2 Implementation Considerat
- Page 112 and 113:
Section 2 Implementation Considerat
- Page 114 and 115:
Section 2 Implementation Considerat
- Page 116 and 117:
Section 2 Implementation Considerat
- Page 118 and 119:
Craddock Consulting Engineers 3-1 I
- Page 120 and 121:
Section 3 Inventory of Major WWTPs
- Page 122 and 123:
Section 3 Inventory of Major WWTPs
- Page 124 and 125:
Figure 3.6. Industrial Reuse Custom
- Page 126 and 127:
Section 3 Inventory of Major WWTPs
- Page 128 and 129:
Figure 3.7b. Ground Water Availabil
- Page 130 and 131:
Section 3 Inventory of Major WWTPs
- Page 132 and 133:
") Figure 3.8c. Cedar River Watersh
- Page 134 and 135:
Section 3 Inventory of Major WWTPs
- Page 136 and 137:
Section 3 Inventory of Major WWTPs
- Page 138 and 139:
Section 3 Inventory of Major WWTPs
- Page 140 and 141:
") ") ") ") Figure 3.10c. Lower Mis
- Page 142 and 143:
Section 3 Inventory of Major WWTPs
- Page 144 and 145:
Section 3 Inventory of Major WWTPs
- Page 146 and 147:
Section 3 Inventory of Major WWTPs
- Page 148 and 149:
Section 3 Inventory of Major WWTPs
- Page 150 and 151:
Section 3 Inventory of Major WWTPs
- Page 152 and 153:
Figure 3.12c. Mississippi River - H
- Page 154 and 155:
Section 3 Inventory of Major WWTPs
- Page 156 and 157:
Section 3 Inventory of Major WWTPs
- Page 158 and 159:
Figure 3.14b. Rainy River Watershed
- Page 160 and 161:
Section 3 Inventory of Major WWTPs
- Page 162 and 163:
Section 3 Inventory of Major WWTPs
- Page 164 and 165:
Section 3 Inventory of Major WWTPs
- Page 166 and 167:
") Figure 3.16c. St. Croix River Wa
- Page 168 and 169:
Section 3 Inventory of Major WWTPs
- Page 170 and 171:
Section 3 Inventory of Major WWTPs
- Page 172 and 173:
Section 3 Inventory of Major WWTPs
- Page 174 and 175:
Figure 3.18 Metro Area Industrial R
- Page 176 and 177:
Section 3 Inventory of Major WWTPs
- Page 178 and 179:
G G Flying Cloud Dr !! G! G Figure
- Page 180 and 181:
Section 3 Inventory of Major WWTPs
- Page 182 and 183:
Figure 3.22. Rogers WWTP - Industri
- Page 184 and 185:
Section 3 Inventory of Major WWTPs
- Page 186 and 187:
G G G! Dodd Rd GG Figure 3.24. Rose
- Page 188 and 189:
Section 3 Inventory of Major WWTPs
- Page 190 and 191:
G Figure 3.26. Hastings WWTP - Indu
- Page 192 and 193:
State Hwy 36 ! Figure 3.28. St. Cro
- Page 194 and 195:
Section 3 Inventory of Major WWTPs
- Page 196 and 197:
Section 3 Inventory of Major WWTPs
- Page 198 and 199:
Craddock Consulting Engineers In As
- Page 200 and 201:
Water Use Code Categories Minnesota
- Page 202 and 203:
Minnesota Water Use for All Categor
- Page 204 and 205:
Air Conditioning 0.2% Waterworks 15
- Page 206 and 207:
Minnesota Water Use, 2000-2004 - St
- Page 208 and 209:
Minnesota Water Use in 2004 (withou
- Page 210 and 211:
Minnesota Water Use in 2000 (withou
- Page 212 and 213:
UseCode by Year Minnesota Power Gen
- Page 214 and 215:
Water Use (MGD) Water Use (MGD) 350
- Page 216 and 217:
Minnesota Industrial Processing Fac
- Page 218 and 219:
Minnesota Industrial Processing Fac
- Page 220 and 221:
Water Use (MGD) Water Use (MGD) 120
- Page 222 and 223:
Water Use (MGD) Water Use (MGD) 13.
- Page 224 and 225:
Craddock Consulting Engineers In As
- Page 226 and 227:
Overview There are no federal regul
- Page 228 and 229:
Appendix B Status of Water Reuse Re
- Page 230 and 231:
Appendix B Status of Water Reuse Re
- Page 232 and 233:
Table 4. Examples of State Water Re
- Page 234 and 235:
Appendix B Status of Water Reuse Re
- Page 236 and 237:
Appendix B Status of Water Reuse Re
- Page 238 and 239:
Setback Distances Appendix B Status
- Page 240 and 241:
Appendix B Status of Water Reuse Re
- Page 242 and 243:
Appendix B Status of Water Reuse Re
- Page 244 and 245:
Appendix B Status of Water Reuse Re
- Page 246 and 247:
Craddock Consulting Engineers In As
- Page 248 and 249:
WATER USE (MGD) WATER USE (MGD) 3.5
- Page 250 and 251:
Table 3.9a. Industrial Water Use in
- Page 252 and 253:
Table 3.10a. Industrial Water Use i
- Page 254 and 255:
Table 3.10d. Industries in the Lowe
- Page 256 and 257:
WATER USE (MGD) WATER USE (MGD) 8 7
- Page 258 and 259: Table 3.11d. Industries in the Minn
- Page 260 and 261: Table 3.11d. Industries in the Minn
- Page 262 and 263: WATER USE (MGD) WATER USE (MGD) 12
- Page 264 and 265: Table 3.12c. Industries in the Miss
- Page 266 and 267: Table 3.12c. Industries in the Miss
- Page 268 and 269: Table 3.12c. Industries in the Miss
- Page 270 and 271: Table 3.12c. Industries in the Miss
- Page 272 and 273: Table 3.13a. Industrial Water Use i
- Page 274 and 275: Table 3.14a. Industrial Water Use i
- Page 276 and 277: Table 3.15a. Industrial Water Use i
- Page 278 and 279: WATER USE (MGD) WATER USE (MGD) 2.5
- Page 280 and 281: WATER USE (MGD) WATER USE (MGD) 0.8
- Page 282 and 283: Table 3.17c. Industries in the West
- Page 284 and 285: MN Permit No Facility Minnesota Mun
- Page 286 and 287: MN Permit No Facility Minnesota Mun
- Page 288 and 289: Craddock Consulting Engineers In As
- Page 290: Minnesota DNR Waters 2005 Ground-wa
- Page 294 and 295: Craddock Consulting Engineers In As
- Page 296 and 297: Permit No. Organization NAICS Code
- Page 298 and 299: Permit No. Organization NAICS Code
- Page 300 and 301: Permit No. Organization NAICS Code
- Page 302 and 303: Permit No. Organization NAICS Code
- Page 304 and 305: Permit No. Organization NAICS Code
- Page 306 and 307: Permit No. Organization NAICS Code
- Page 310 and 311: Metropolitan Council Recycling Trea
- Page 312 and 313: TM2: Sampling Plan and Results Recy
- Page 314 and 315: TM2: Sampling Plan and Results Recy
- Page 316 and 317: TM2: Sampling Plan and Results Recy
- Page 318 and 319: TM2: Sampling Plan and Results Recy
- Page 320 and 321: TM2: Sampling Plan and Results Recy
- Page 322 and 323: TM2: Sampling Plan and Results Recy
- Page 324 and 325: TM2: Sampling Plan and Results Recy
- Page 326 and 327: Recommended Limits for Various Indu
- Page 328: Exhibit B Blue Lake WWTP Sampling R
- Page 331 and 332: MCES Blue Lake Plant Final Effluent
- Page 333 and 334: Date Day of Wk MCES Blue Lake Plant
- Page 335 and 336: Date Day of Wk MCES Blue Lake Plant
- Page 337 and 338: Date Day of Wk MCES Blue Lake Plant
- Page 340 and 341: MCES Empire Plant Final Effluent Sa
- Page 342 and 343: Date Day of Wk 10/24/06 Tuesday 10/
- Page 344 and 345: Date Day of Wk 10/24/06 Tuesday 10/
- Page 346 and 347: Date Day of Wk 10/24/06 Tuesday 10/
- Page 348 and 349: Exhibit D Metropolitan (Metro) WWTP
- Page 350 and 351: MCES Metropolitan Plant Final Efflu
- Page 352 and 353: Date Day of Wk 4/19/07 Thursday 4/2
- Page 354 and 355: Date Day of Wk 4/19/07 Thursday 4/2
- Page 356 and 357: Date Day of Wk 4/19/07 Thursday 4/2
- Page 358 and 359:
MCES Seneca Plant Final Effluent Sa
- Page 360 and 361:
Date Day of Wk 10/8/06 Sunday 10/9/
- Page 362 and 363:
Date Day of Wk 10/8/06 Sunday 10/9/
- Page 364 and 365:
Date Day of Wk 10/8/06 Sunday 10/9/
- Page 366 and 367:
Metropolitan Council Recycling Trea
- Page 368 and 369:
Section 5 - Costs Table of Contents
- Page 370 and 371:
TM3: Recycled Wastewater System Com
- Page 372 and 373:
TM3: Recycled Wastewater System Com
- Page 374 and 375:
WWTP 1 - 2 - 3 - 4 - 5 - 1 Treatmen
- Page 376 and 377:
TM3: Recycled Wastewater System Com
- Page 378 and 379:
TM3: Recycled Wastewater System Com
- Page 380 and 381:
TM3: Recycled Wastewater System Com
- Page 382:
o Synthetic medium o Two-stage Surf
- Page 385 and 386:
TM3: Recycled Wastewater System Com
- Page 387 and 388:
TM3: Recycled Wastewater System Com
- Page 389 and 390:
TM3: Recycled Wastewater System Com
- Page 391 and 392:
TM3: Recycled Wastewater System Com
- Page 393 and 394:
TM3: Recycled Wastewater System Com
- Page 395 and 396:
TM3: Recycled Wastewater System Com
- Page 397 and 398:
TM3: Recycled Wastewater System Com
- Page 399 and 400:
TM3: Recycled Wastewater System Com
- Page 401 and 402:
TM3: Recycled Wastewater System Com
- Page 403 and 404:
Table 13 WATER REUSE SYSTEM COST OF
- Page 405 and 406:
TM3: Recycled Wastewater System Com
- Page 407 and 408:
TM3: Recycled Wastewater System Com
- Page 409 and 410:
Cost of Service, $/1000 gallon 1.00
- Page 411 and 412:
TM3: Recycled Wastewater System Com
- Page 413 and 414:
TM3: Recycled Wastewater System Com
- Page 415 and 416:
TM3: Recycled Wastewater System Com
- Page 417 and 418:
TM3: Recycled Wastewater System Com
- Page 419 and 420:
Cost of Service, $/1000 gallons 8.0
- Page 421 and 422:
TM3: Recycled Wastewater System Com
- Page 423 and 424:
Appendix A Water Reuse Regulatory E
- Page 425 and 426:
Table A-1. 2000 California Water Re
- Page 427 and 428:
California Department of Health Ser
- Page 429 and 430:
Other Media Type Filters Fuzzy Filt
- Page 431 and 432:
Appendix B TECHNICAL MEMORANDUM Rec
- Page 433 and 434:
Appendix B Reclaimed Water Transmis
- Page 435 and 436:
Exhibit 1 Transmission Main Cost To
- Page 437 and 438:
Pipe Installation Data (DR 18 PVC P
- Page 439 and 440:
Equipment Costs (with O&P) Item Des
- Page 441 and 442:
Water Reuse Pipe Line Construction
- Page 443 and 444:
Construction Unit Costs Item (2006
- Page 445 and 446:
Crew Costs (with O&P) St. Paul Pres
- Page 447 and 448:
Capital PROJECT Cost Curves for Rec
- Page 449 and 450:
Diam (in) Annual Average Day Flow A
- Page 451 and 452:
Diam (in) Annual Average Day Flow A
- Page 453 and 454:
Pipe Capital Project Cost, $ Millio
- Page 455 and 456:
Pipe Capital Project Cost, $/1000 g
- Page 457 and 458:
Capital PROJECT Cost Curves for Rec
- Page 459 and 460:
Capital PROJECT Cost Curves for Rec
- Page 461 and 462:
Annual Pipe Average Annual Velocity
- Page 463 and 464:
Pipe Capital Project Cost, $ Millio
- Page 465 and 466:
Exhibit 3 Water Reuse System O&M Co
- Page 467 and 468:
Diam (in) Annual Average Day Flow (
- Page 469 and 470:
Diam (in) Annual Average Day Flow (
- Page 471 and 472:
Diam (in) Annual Average Day Flow (
- Page 473 and 474:
Diam (in) Annual Average Day Flow (
- Page 475 and 476:
Pumping Cost, $/1000 gallons 0.095
- Page 477 and 478:
Water Reuse System Estimated Cost o
- Page 479 and 480:
WATER REUSE SYSTEM COST OF SERVICE
- Page 481 and 482:
WATER REUSE SYSTEM COST OF SERVICE
- Page 483 and 484:
WATER REUSE SYSTEM COST OF SERVICE
- Page 485 and 486:
WATER REUSE SYSTEM COST OF SERVICE
- Page 487 and 488:
WATER REUSE SYSTEM COST OF SERVICE
- Page 489 and 490:
Appendix D-1 Water Reuse System Cos
- Page 491 and 492:
Water Reuse System Estimates of Pro
- Page 493 and 494:
Cost of Service, $/1000 gallon 2.00
- Page 495 and 496:
Cost Curves as Basis for Tertiary 1
- Page 497 and 498:
Cost Curves as Basis for Tertiary 1
- Page 499 and 500:
Water Reuse System Estimated Cost o
- Page 501 and 502:
Cost of Service, $/1000 gallon 10.0
- Page 503 and 504:
Cost Curves as Basis for Tertiary 2
- Page 505 and 506:
Appendix D-3 Water Reuse System Cos
- Page 507 and 508:
Water Reuse System Estimates of Pro
- Page 509 and 510:
Cost of Service, $/1000 gallon 5.00
- Page 511 and 512:
Cost Curves as Basis for Tertiary 3
- Page 513 and 514:
Water Reuse System Estimated Cost o
- Page 515 and 516:
Cost of Service, $/1000 gallon 10.0
- Page 517 and 518:
Cost Curves as Basis for Tertiary 4
- Page 519 and 520:
Appendix D-5 Water Reuse System Cos
- Page 521 and 522:
Water Reuse System Estimates of Pro
- Page 523 and 524:
Cost of Service, $/1000 gallon 5.00
- Page 525 and 526:
Appendix D-6 Water Reuse System Cos
- Page 527 and 528:
Water Reuse System Estimates of Pro
- Page 529 and 530:
Cost of Service, $/1000 gallon 5.00
- Page 531 and 532:
Cost Curves as Basis for Tertiary 4
- Page 533 and 534:
Secondary Treatment Assumptions Sus
- Page 535 and 536:
Secondary Treatment Assumptions Sus
- Page 537 and 538:
Secondary Treatment Assumptions Sus
- Page 539 and 540:
Secondary Treatment Assumptions Sus
- Page 541 and 542:
Craddock Consulting Engineers 1 In
- Page 543 and 544:
TM4: WWTP Effluent Quality Recyclin
- Page 545 and 546:
!( !( !( !( !( !( !( !( !( !( !( !(
- Page 547 and 548:
TM4: WWTP Effluent Quality Recyclin
- Page 549 and 550:
Frequency of Occurrence, % Frequenc
- Page 551 and 552:
No. of Plants Total Permitting Desi
- Page 553 and 554:
TM4: WWTP Effluent Quality Recyclin
- Page 555 and 556:
!( !( !( !( !( !( !( !( !( !( !( !(
- Page 557 and 558:
TM4: WWTP Effluent Quality Recyclin
- Page 559 and 560:
Frequency of Occurrence, % Frequenc
- Page 561 and 562:
No. of Plants Total Permitting Desi
- Page 563 and 564:
TM4: WWTP Effluent Quality Recyclin
- Page 565 and 566:
!( !( !( !( !( !( !( !( !( !( !( !(
- Page 567 and 568:
TM4: WWTP Effluent Quality Recyclin
- Page 569 and 570:
Craddock Consulting Engineers 1 In
- Page 571 and 572:
1.0 Introduction This technical mem
- Page 573 and 574:
Exhibit A Regulatory Stakeholder Me
- Page 575 and 576:
MCES Recycling Treated Wastewater f
- Page 577 and 578:
MCES Recycling Treated Wastewater f
- Page 579 and 580:
Municipal Wastewater Reuse Regulato
- Page 581 and 582:
MCES Recycling Treated Wastewater f
- Page 583 and 584:
Exhibit B Industry Stakeholder Meet
- Page 585 and 586:
Recycling Treated Wastewater For In
- Page 587 and 588:
Institutional Issues Topic Discussi
- Page 589 and 590:
Institutional Issues Topic Discussi
- Page 591 and 592:
Recycling Treated Wastewater For In
- Page 593 and 594:
Recycling Treated Wastewater For In
- Page 595 and 596:
Recycling Treated Wastewater For In
- Page 597 and 598:
Recycling Treated Wastewater For In
- Page 599 and 600:
Exhibit C Broader Base Stakeholder
- Page 601 and 602:
Recycling Treated Wastewater For In
- Page 603 and 604:
Recycling Treated Wastewater For In
- Page 605 and 606:
Recycling Treated Wastewater For In
- Page 607 and 608:
Recycling Treated Wastewater For In
- Page 609 and 610:
Recycling Treated Wastewater For In
- Page 611 and 612:
Recycling Treated Wastewater For In