- Page 1 and 2:
UNIVERSITY OF AGRONOMICAL SCIENCES
- Page 3 and 4:
SCIENTIFIC COMMITTEEProf. Dr. Petru
- Page 5 and 6:
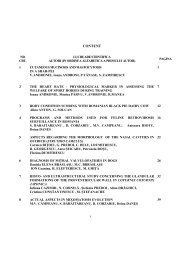
CONTENTSECTION I: AGRICULTURAL BIOT
- Page 7 and 8:
SECTION IV: INDUSTRIAL AND ENVIRONM
- Page 9 and 10:
Proceeding of the 3 rd Internationa
- Page 11 and 12:
All the biological material (positi
- Page 13 and 14:
At harvesting, symptoms could be in
- Page 15 and 16:
Necrotic Disease (PTRND) induced by
- Page 17 and 18:
Eppendorfer, W., H., Eggum, B.,O.,
- Page 19 and 20:
Now Lamium genus from Lamiaceae fam
- Page 21 and 22:
extracts and rutin, hyperoside, chl
- Page 23 and 24:
Figure 3. Scavenging activity on DP
- Page 25 and 26:
CO-TRANSFORMATION OF POTATO (SOLANU
- Page 27 and 28:
transferred OCI and OCII genes were
- Page 29 and 30:
correspond to co-transformation fre
- Page 31 and 32:
EXPERIMENTS ON LASER RADIATION INFL
- Page 33 and 34:
formations. The average percentage
- Page 35 and 36:
Legend: Variants: V1 (5 minutes of
- Page 37 and 38:
We thank our partners at 4R OPTICS
- Page 39 and 40:
Regarding superior plants they are
- Page 41 and 42:
Fig. 2. The mechanism of the abscis
- Page 43 and 44:
In figure 3 it is presented the bio
- Page 45 and 46:
In the same time it has been proved
- Page 47 and 48:
egenerative lines of alfalfa, Wan e
- Page 49 and 50:
demonstrated direct regeneration fr
- Page 51 and 52:
(Knoll et al. 1997, Zhang and Zeeva
- Page 53 and 54:
the mean ± standard error. Six sam
- Page 55 and 56:
IMPACT OF PHOTOPERIOD ON SPINACH RE
- Page 57 and 58:
etween SD and LD response of the sa
- Page 59 and 60:
GA 3 plays an important role in spi
- Page 61 and 62:
INFLUENCE OF POLYETHYLENE GLYCOL (P
- Page 63 and 64:
enriched with 20 g / l sucrose, 8g
- Page 65 and 66:
If we compare the two varieties Roc
- Page 67 and 68:
For Roclas cultivar, the highest nu
- Page 69 and 70:
RESEARCH ON THE AVERAGE NUMBER OFPO
- Page 71 and 72:
two weeks before the harvest, were
- Page 73 and 74:
from minitubersfrom plantlets8.637.
- Page 75 and 76:
If biological material influences t
- Page 77 and 78:
BIOTECHNOLOGY OF ORGANIC CULTIVATIO
- Page 79 and 80:
RESULTS AND DISCUSSIONAccording to
- Page 81 and 82: nitrogen sources, barley bran was t
- Page 83 and 84: In figure 5 the effects of inoculum
- Page 85 and 86: DORMANCY OF SEEDS AND HIS IMPORTANC
- Page 87 and 88: Dor. Large samples of grain were ha
- Page 89 and 90: Precip.23.06.200524.06.200525.06.20
- Page 91 and 92: certificates technologies. In the o
- Page 93 and 94: PROBLEMS RELATED TO RECULTIVATION O
- Page 95 and 96: Fig. 2 - Density of tests making in
- Page 97 and 98: The analysis made of the conditions
- Page 99 and 100: The mixtures are intense dynamic bi
- Page 101 and 102: Mixed growing of wintering pea and
- Page 103 and 104: RHODIOLA ROSEA L. IN VITRO CULTURES
- Page 105 and 106: from Rila Mountain National Park of
- Page 107 and 108: In vitro seed germination and devel
- Page 109 and 110: Along with rhizogenesis, shoot form
- Page 111 and 112: 4. Ganzera, M., Yayla, Y., Khan, I.
- Page 113 and 114: 1994), while timentin stimulated mo
- Page 115 and 116: 1 and 2.5 mg/l hyg were not necroti
- Page 117 and 118: Nevertheless, we suggest stepwise i
- Page 119 and 120: SECTION II: BIOTECHNOLOGY IN VETERI
- Page 121 and 122: The young pigs were fed in accordan
- Page 123 and 124: LЕ39,8344,06100,25LЕ29,7944,793,6
- Page 125 and 126: During the digestibility test daily
- Page 127 and 128: - The use of fodder per unit of liv
- Page 129 and 130: Table 1- The observational data for
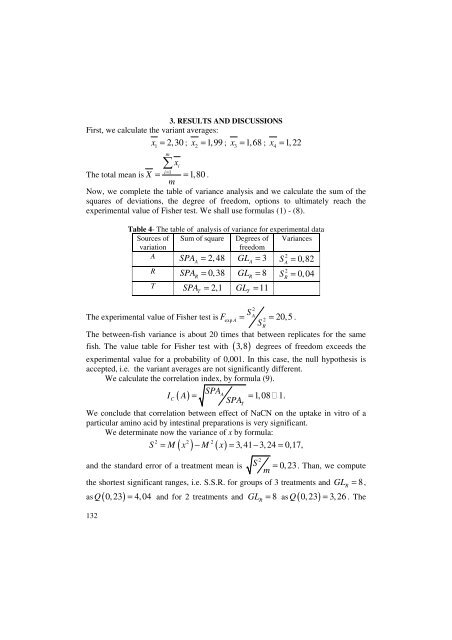
- Page 131: Having arranged the treatment means
- Page 135 and 136: processes that occur during the win
- Page 137 and 138: hundreds of fermenting experiences
- Page 139 and 140: In the case of spontaneous malolact
- Page 141 and 142: With enzymeNo enzymesAstringencyRou
- Page 143 and 144: RESEARCHES ON THE BIOTECHNOLOGY POS
- Page 145 and 146: from Merlot grapes, with 224 g / l
- Page 147 and 148: lasted 12 days, while the variants
- Page 149 and 150: case of the produces fermentation.
- Page 151 and 152: itself a protective factor against
- Page 153 and 154: THE INFLUENCE OF THE CHEMICAL COMPO
- Page 155 and 156: Sample witness Thiamine Magnesium s
- Page 157 and 158: Both the vitamines (thiamine) and t
- Page 159 and 160: This reaction takes place inside th
- Page 161 and 162: Sample witness Glycerol 2.5% Glycer
- Page 163 and 164: The intensity of the connection can
- Page 165 and 166: HIGH NUTRITIVE BIOMASS OF EDIBLE AN
- Page 167 and 168: According to the purpose of this wo
- Page 169 and 170: Experiments were carried out in thr
- Page 171 and 172: Table 5. The sugar and total nitrog
- Page 173 and 174: STUDY OF THE CORRELATIONS BETWEEN G
- Page 175 and 176: The analyzed wheat was characterize
- Page 177 and 178: The lack of a significant relations
- Page 179 and 180: (phenotypically influenced) and glu
- Page 181 and 182: DP700 integrator was used. Compound
- Page 183 and 184:
Of the esters were identified:•2-
- Page 185 and 186:
Table 4 - Concentration of terpenes
- Page 187 and 188:
SECTION IV: INDUSTRIAL AND ENVIRONM
- Page 189 and 190:
Table 2. Variation of the compositi
- Page 191 and 192:
YoghurtAcerbityFresh butterVerdantF
- Page 193 and 194:
1991). This imposes the need of new
- Page 195 and 196:
The crop weeds occurrence (mainly w
- Page 197 and 198:
formation in the variant fertilized
- Page 199 and 200:
gypsum from Sero-Cleaning Installat
- Page 201 and 202:
DepthcmTable 1. Water soluble salts
- Page 203 and 204:
egulation in mixed filling of ashes
- Page 205 and 206:
The aim of this paper is to use the
- Page 207 and 208:
RESULTS AND DISCUSSIONPreliminary e
- Page 209 and 210:
M1 T1 A B T2 A BM2 T1 A B T2 A BM3
- Page 211 and 212:
As one can see in figure 4, the hig
- Page 213 and 214:
STUDIES ON IMMOBILIZATION OF CELLUL
- Page 215 and 216:
Total immobilizatedprotein (%)80706
- Page 217 and 218:
PHYTOREMEDIATION OF LEAD CONTAMINAT
- Page 219 and 220:
are placed through holes in the gro
- Page 221 and 222:
To highlight phyto-remediation test
- Page 223 and 224:
• The leaves have different abili
- Page 225 and 226:
include xylanase, endoxylanase, 1,4
- Page 227 and 228:
In Taguchi technique, the variation
- Page 229 and 230:
REFERENCES1.Amita, R.S., Shah, R.K.
- Page 231 and 232:
molecules, such as proteins, DNA, a
- Page 233 and 234:
• Quantitative determination of s
- Page 235 and 236:
Antioxidant activityDPPH- Free radi
- Page 237 and 238:
quantitative determination of the f
- Page 239 and 240:
ANTIOXIDANT BIOPRODUCT WITHIMMUNOMO
- Page 241 and 242:
evaluations of the specific physica
- Page 243 and 244:
TNF-α (pg/ml)100090080070060050040
- Page 245 and 246:
THE ENVIRONMENTAL IMPACT OF VITICUL
- Page 247 and 248:
hydrocarbon components such as benz
- Page 249 and 250:
RESULTS AND DISCUSSIONThe wine indu
- Page 251 and 252:
CONCLUSIONIt takes 16 months under
- Page 253 and 254:
VANILLIN RELEASE FROM AGAR MICROCAP
- Page 255 and 256:
only considering that an amount of
- Page 257 and 258:
Fig 4. Surface vanillin (SV) versus
- Page 259 and 260:
containing pumpkin extracts (1 ml/l
- Page 261 and 262:
Table1 Effect of different types of
- Page 263 and 264:
Table 3. Acclimatization of А. mon
- Page 265 and 266:
SECTION V: FOOD SAFETYSENSORY ANALY
- Page 267 and 268:
Depending on the product analysed,
- Page 269 and 270:
Sensory analysis for organic versus
- Page 271 and 272:
organic sample), colour (3,85 compa
- Page 273 and 274:
Fig. 1.7. Organic (QAF) versus conv
- Page 275 and 276:
CONTROL OF MICROBIAL GROWTH AND ENZ
- Page 277 and 278:
determined in order to establish th
- Page 279 and 280:
3,53log N (N = NTG/g apple slices)2
- Page 281 and 282:
a - control; b - apple slices spray
- Page 283 and 284:
DETERMINATION OF BIOCHEMICAL MARKER
- Page 285 and 286:
Tabel 1. Characteristics of experim
- Page 287 and 288:
The maximmal value has been recorde
- Page 289 and 290:
Fig 3. Sensors responses for sample
- Page 291 and 292:
AN OVERVIEW OF THE METHODS USED TO
- Page 293 and 294:
After the sample extraction, the se
- Page 295 and 296:
REFERENCES1. Bosset, J. O., Jeangro
- Page 297 and 298:
CASE STUDY - METHODS AND FILM PACKA
- Page 299 and 300:
Backbone Solution that provides bas
- Page 301 and 302:
85 X 55 MM (CREDIT CARD SIZE) OR SM
- Page 303 and 304:
the exposing of the entire range of
- Page 305 and 306:
REFERENCES1. Agency - March 2002 -
- Page 307 and 308:
keep the value of sensory and nutri
- Page 309 and 310:
Material exposure to UV radiation w
- Page 311 and 312:
Fig. 6. Influence of UV duration on
- Page 313 and 314:
Table 3.4. The influence of PEF + U
- Page 315 and 316:
SECTION VI: MISCELLANEOUSCOMPUTERIZ
- Page 317 and 318:
The computer measures the encasing
- Page 319 and 320:
measurements bulletin is typed by t
- Page 321 and 322:
5. CONCLUSIONSThe implementation of
- Page 323 and 324:
• the knowledge and the informati
- Page 325 and 326:
The Agri-Food KMP will be extended,
- Page 327 and 328:
REFERENCES1. Abell, A. A. and Oxbro
- Page 329 and 330:
quicker translocation of the raw sa
- Page 331 and 332:
with X1 [ a,b]such that M ( θ )( )
- Page 333:
as it leads us in the right directi