020318_Hurghada SECAP_FINAL

Create successful ePaper yourself
Turn your PDF publications into a flip-book with our unique Google optimized e-Paper software.
Energy consumption in GWh<br />
12.0<br />
10.0<br />
8.0<br />
6.0<br />
4.0<br />
2.0<br />
9000<br />
8000<br />
7000<br />
6000<br />
5000<br />
4000<br />
3000<br />
2000<br />
1000<br />
Annual cost in kEGP<br />
0.0<br />
Municipal building Public lighting Municipal Fleet Water and Waste<br />
management<br />
0<br />
GWh/an<br />
EGP<br />
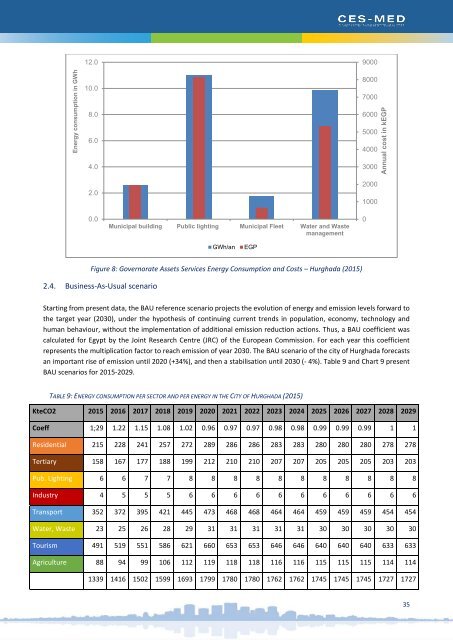
Figure 8: Governorate Assets Services Energy Consumption and Costs – <strong>Hurghada</strong> (2015)<br />
2.4. Business-As-Usual scenario<br />
Starting from present data, the BAU reference scenario projects the evolution of energy and emission levels forward to<br />
the target year (2030), under the hypothesis of continuing current trends in population, economy, technology and<br />
human behaviour, without the implementation of additional emission reduction actions. Thus, a BAU coefficient was<br />
calculated for Egypt by the Joint Research Centre (JRC) of the European Commission. For each year this coefficient<br />
represents the multiplication factor to reach emission of year 2030. The BAU scenario of the city of <strong>Hurghada</strong> forecasts<br />
an important rise of emission until 2020 (+34%), and then a stabilisation until 2030 (- 4%). Table 9 and Chart 9 present<br />
BAU scenarios for 2015-2029.<br />
TABLE 9: ENERGY CONSUMPTION PER SECTOR AND PER ENERGY IN THE CITY OF HURGHADA (2015)<br />
KteCO2 2015 2016 2017 2018 2019 2020 2021 2022 2023 2024 2025 2026 2027 2028 2029<br />
Coeff 1;29 1.22 1.15 1.08 1.02 0.96 0.97 0.97 0.98 0.98 0.99 0.99 0.99 1 1<br />
Residential 215 228 241 257 272 289 286 286 283 283 280 280 280 278 278<br />
Tertiary 158 167 177 188 199 212 210 210 207 207 205 205 205 203 203<br />
Pub. Lighting 6 6 7 7 8 8 8 8 8 8 8 8 8 8 8<br />
Industry 4 5 5 5 6 6 6 6 6 6 6 6 6 6 6<br />
Transport 352 372 395 421 445 473 468 468 464 464 459 459 459 454 454<br />
Water, Waste 23 25 26 28 29 31 31 31 31 31 30 30 30 30 30<br />
Tourism 491 519 551 586 621 660 653 653 646 646 640 640 640 633 633<br />
Agriculture 88 94 99 106 112 119 118 118 116 116 115 115 115 114 114<br />
1339 1416 1502 1599 1693 1799 1780 1780 1762 1762 1745 1745 1745 1727 1727<br />
35