020318_Hurghada SECAP_FINAL

Create successful ePaper yourself
Turn your PDF publications into a flip-book with our unique Google optimized e-Paper software.
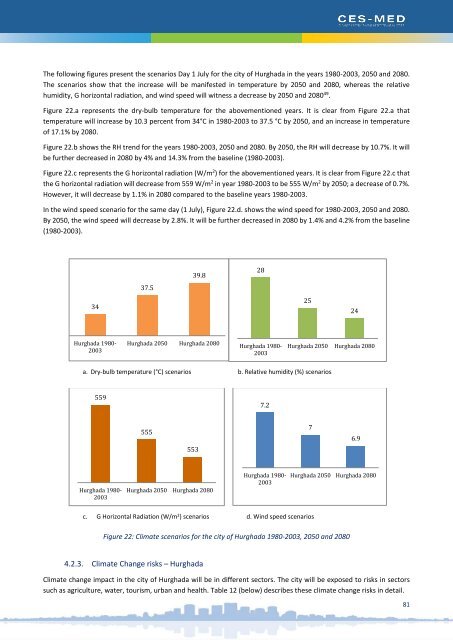
The following figures present the scenarios Day 1 July for the city of <strong>Hurghada</strong> in the years 1980-2003, 2050 and 2080.<br />
The scenarios show that the increase will be manifested in temperature by 2050 and 2080, whereas the relative<br />
humidity, G horizontal radiation, and wind speed will witness a decrease by 2050 and 2080 49 .<br />
Figure 22.a represents the dry-bulb temperature for the abovementioned years. It is clear from Figure 22.a that<br />
temperature will increase by 10.3 percent from 34°C in 1980-2003 to 37.5 °C by 2050, and an increase in temperature<br />
of 17.1% by 2080.<br />
Figure 22.b shows the RH trend for the years 1980-2003, 2050 and 2080. By 2050, the RH will decrease by 10.7%. It will<br />
be further decreased in 2080 by 4% and 14.3% from the baseline (1980-2003).<br />
Figure 22.c represents the G horizontal radiation (W/m 2 ) for the abovementioned years. It is clear from Figure 22.c that<br />
the G horizontal radiation will decrease from 559 W/m 2 in year 1980-2003 to be 555 W/m 2 by 2050; a decrease of 0.7%.<br />
However, it will decrease by 1.1% in 2080 compared to the baseline years 1980-2003.<br />
In the wind speed scenario for the same day (1 July), Figure 22.d. shows the wind speed for 1980-2003, 2050 and 2080.<br />
By 2050, the wind speed will decrease by 2.8%. It will be further decreased in 2080 by 1.4% and 4.2% from the baseline<br />
(1980-2003).<br />
39.8<br />
28<br />
37.5<br />
34<br />
25<br />
24<br />
<strong>Hurghada</strong> 1980-<br />
2003<br />
<strong>Hurghada</strong> 2050 <strong>Hurghada</strong> 2080<br />
<strong>Hurghada</strong> 1980-<br />
2003<br />
<strong>Hurghada</strong> 2050 <strong>Hurghada</strong> 2080<br />
a. Dry-bulb temperature (°C) scenarios b. Relative humidity (%) scenarios<br />
559<br />
7.2<br />
555<br />
553<br />
7<br />
6.9<br />
<strong>Hurghada</strong> 1980-<br />
2003<br />
<strong>Hurghada</strong> 2050 <strong>Hurghada</strong> 2080<br />
<strong>Hurghada</strong> 1980-<br />
2003<br />
<strong>Hurghada</strong> 2050 <strong>Hurghada</strong> 2080<br />
c. G Horizontal Radiation (W/m 2 ) scenarios d. Wind speed scenarios<br />
Figure 22: Climate scenarios for the city of <strong>Hurghada</strong> 1980-2003, 2050 and 2080<br />
4.2.3. Climate Change risks – <strong>Hurghada</strong><br />
Climate change impact in the city of <strong>Hurghada</strong> will be in different sectors. The city will be exposed to risks in sectors<br />
such as agriculture, water, tourism, urban and health. Table 12 (below) describes these climate change risks in detail.<br />
81