- Page 1 and 2: This project is funded by the Europ
- Page 3 and 4: EuropeAid/132630/C/SER/Multi CLEANE
- Page 5 and 6: Table of contents EXECUTIVE SUMMARY
- Page 7 and 8: 4. CLIMATE DATA AND CLIMATE CHANGE
- Page 9 and 10: List of tables TABLE 1: EMISSION FA
- Page 11 and 12: Section III: Actions Planned This s
- Page 13 and 14: capacities under construction, resu
- Page 15 and 16: 5 million magnetic ballasts with di
- Page 17 and 18: To mobilize all stakeholders in and
- Page 19 and 20: 9. Coordinate with the government o
- Page 21 and 22: technical support of CES-MED, if re
- Page 23 and 24: - Information on national energy po
- Page 25 and 26: Section II: Baseline Emission Inven
- Page 27 and 28: Figure 2: Considered themes in BEI
- Page 29 and 30: 1.3.2.1 Residential buildings In th
- Page 31 and 32: Volume Energy equivalent Diesel con
- Page 33 and 34: Air transport was estimated from th
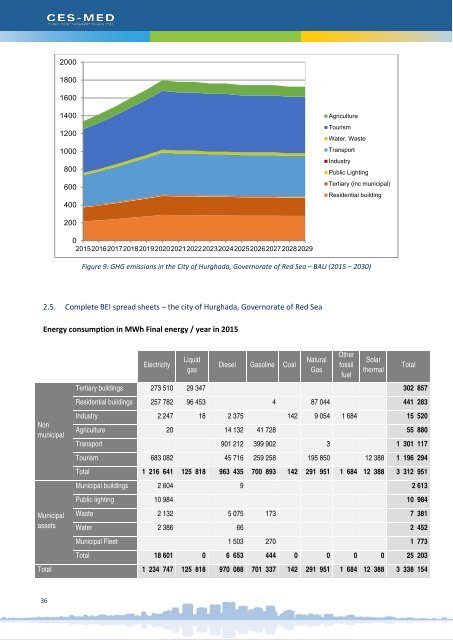
- Page 35 and 36: average. Although, this figure stil
- Page 37: Energy consumption in GWh 12.0 10.0
- Page 41 and 42: Governorate of the Red Sea in 2015
- Page 43 and 44: and climate transition, • It will
- Page 45 and 46: temperature control system. There i
- Page 47 and 48: Even if LED lamps cost far more (hi
- Page 49 and 50: 4.1.3.4 Budget These figures are ro
- Page 51 and 52: 4.1.6. Awareness campaign 4.1.6.1 C
- Page 53 and 54: of the Red Sea, would implement a S
- Page 55 and 56: sustainable and green tourism throu
- Page 57 and 58: power air compressors for diving ac
- Page 59 and 60: To design and implement an adequate
- Page 61 and 62: Energy in MWh/year Situation in 201
- Page 63 and 64: 4.3.3. Biogas As previously mention
- Page 65 and 66: Section IV: Climate Adaptation Plan
- Page 67 and 68: populated cities and suburbs). In t
- Page 69 and 70: Severe floods hit Alexandria, 24th
- Page 71 and 72: scenario is estimated to be about 1
- Page 73 and 74: place in many cities such as Alexan
- Page 75 and 76: • Third National Communication on
- Page 77 and 78: − Develop a database for all chan
- Page 79 and 80: a. Maximum & Minimum temperature Fe
- Page 81 and 82: Temperature 4.2.1. Main climate tre
- Page 83 and 84: The following figures present the s
- Page 85 and 86: and August 2017. More specifically:
- Page 87 and 88: The Governorate of the Red Sea (mun
- Page 90:
Receptors Extreme weather event - A
- Page 94:
Infrastructure Receptors Social Ext
- Page 98:
Receptors Extreme weather event Pot
- Page 102:
Receptors Extreme weather event Pot
- Page 105 and 106:
Sea level rise* Significantly fewer
- Page 107 and 108:
Sea level rise* Significantly fewer
- Page 109 and 110:
een created to mitigate and evaluat
- Page 111 and 112:
6.2.2.2 Coastal Zones Adaptation op
- Page 113 and 114:
• Alert /Communication actions: T
- Page 115 and 116:
Controlled flood management zones h
- Page 117 and 118:
Alert / Communication Educational T
- Page 119 and 120:
Technical Utilization of drip irrig
- Page 121 and 122:
tourists’ transports that current
- Page 123 and 124:
in particular and in the Governorat
- Page 125 and 126:
3. Organization and procedures Form
- Page 127 and 128:
- European Commission (EC), - Europ
- Page 129 and 130:
2. City of Hurghada (Governorate of
- Page 131 and 132:
- Climate Change Risk Management Pr
- Page 133 and 134:
• Ministry of Tourism (MoTrm) - r
- Page 135 and 136:
Component 4 It will assess costs of
- Page 137 and 138:
6. Assumptions and risks - The key
- Page 139 and 140:
3. City of Hurghada (Governorate of
- Page 141 and 142:
- Second National Communication on
- Page 143 and 144:
Administrative and coordination pro
- Page 145 and 146:
The action plans (stage A) to suppl
- Page 147 and 148:
converting Hotels and resorts by na
- Page 149 and 150:
- Kuwait Fund for Arab Economic Dev
- Page 151 and 152:
- Egypt’s Sustainable Development
- Page 153 and 154:
- Turn off electric equipment at th
- Page 155 and 156:
- Municipality and Governorate - Go
- Page 157 and 158:
Return on Investment (draft calcula
- Page 159 and 160:
5. City of Hurghada - Governorate o
- Page 161 and 162:
- Public Private Partnership - PPP
- Page 163 and 164:
Administrative and coordination pro
- Page 165 and 166:
design and implement an adequate en
- Page 167 and 168:
and ensure the implementation of th
- Page 169 and 170:
- Abu Dhabi Fund for Development (A
- Page 171 and 172:
Renewable energy at the city of Hur
- Page 173 and 174:
- Design of Feed-in Tariffs 2012, -
- Page 175 and 176:
* Calculation based on 1,278 € pe
- Page 177 and 178:
- Ministry of Defense (MoD) and Min
- Page 179 and 180:
Draft calculation of the NPV and re
- Page 181 and 182:
7. City of Hurghada - Governorate o
- Page 183 and 184:
- Environmental Awareness - Trainin
- Page 185 and 186:
1. More efficient use of energy, es
- Page 187 and 188:
• Successful projects in national
- Page 189 and 190:
8. City of Hurghada - Governorate o
- Page 191 and 192:
- Code for Improving Energy Consump
- Page 193 and 194:
Costal Zones sector: 1. Reduce clim
- Page 195 and 196:
permits, approvals and follow up pr
- Page 197 and 198:
- European Bank for Reconstruction
- Page 199 and 200:
o o Table 3 presents the proposed a
- Page 201 and 202:
I. Identification of the target aud
- Page 203 and 204:
sector. It would be recommended to
- Page 205 and 206:
- Roles and responsibilities (Commu
- Page 207 and 208:
Carnival competition (Ministry of I
- Page 209 and 210:
enefits and the feasibility of inve
- Page 211 and 212:
6 months apart from heavy tourist s
- Page 213 and 214:
- With the campaign 2.1.1, link the
- Page 215 and 216:
The dependence of Marinas and yacht
- Page 217 and 218:
Template 3.2 CAPP activities as rel
- Page 219 and 220:
- Smart service for smart people -
- Page 221 and 222:
protection, Promote green tourism i
- Page 223 and 224:
adapt/improve measures according to
- Page 225 and 226:
Omran E. Frihy, Khalid M. DewidarMo
- Page 227:
The European Union is made up of 28