Fiabilidad de los predictores clínicos y de la biopsia de arteria ...
Fiabilidad de los predictores clínicos y de la biopsia de arteria ...
Fiabilidad de los predictores clínicos y de la biopsia de arteria ...

Create successful ePaper yourself
Turn your PDF publications into a flip-book with our unique Google optimized e-Paper software.
<strong>Fiabilidad</strong> <strong>de</strong> <strong>los</strong> <strong>predictores</strong> <strong>clínicos</strong> y <strong>de</strong> <strong>la</strong> <strong>biopsia</strong> <strong>de</strong> <strong>arteria</strong> temporal en el diagnóstico <strong>de</strong> <strong>la</strong> arteritis <strong>de</strong> célu<strong>la</strong>s gigantes<br />
Joan Brunsó Casel<strong>la</strong>s<br />
300<br />
250<br />
200<br />
150<br />
100<br />
50<br />
0<br />
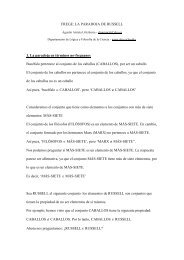
Figura 58: Diagrama que muestra <strong>la</strong> distribución <strong>de</strong> <strong>los</strong> pacientes según el nivel <strong>de</strong> PCR:<br />
mayor o menor a 4 mg/L.<br />
P=0.000<br />
105<br />
166<br />
56<br />
15<br />
PCR ≤ 4 PCR > 4<br />
Un rango <strong>de</strong> PCR > 4 mg/ L concentra <strong>la</strong> mayor proporción <strong>de</strong> resultados positivos <strong>de</strong><br />
<strong>la</strong> BAT. Un valor <strong>de</strong> <strong>la</strong> PCR > 4 mg/L se asocia con un resultado positivo <strong>de</strong> <strong>la</strong> BAT<br />
(p=0.000) y presenta una especificidad muy alta: 91.17% (fig. 58).<br />
103<br />
[95% Confi<strong>de</strong>nce Interval]<br />
---------------------------------------------------------------------------<br />
Prevalence Pr(A) 21% 17% 25.5%<br />
---------------------------------------------------------------------------<br />
Sensitivity Pr(+|A) 34.78% 29.3% 39.2%<br />
Specificity Pr(-|N) 91.17% 85.6% 96.6%<br />
ROC area (Sens. + Spec.)/2 .629 .575 .694<br />
---------------------------------------------------------------------------<br />
Likelihood ratio (+) Pr(+|A)/Pr(+|N) 3.93 2.68 4.81<br />
Likelihood ratio (-) Pr(-|A)/Pr(-|N) .71 .574 .862<br />
Odds ratio LR(+)/LR(-) 5.53 3.82 7.98<br />
Positive predictive value Pr(A|+) 78.87 % 64.3% 84.2%<br />
Negative predictive value Pr(N|-) 38.74% 33.6% 44.9%<br />
--------------------------------------------------------------------<br />
BAT positiva<br />
BAT negativa