Fiabilidad de los predictores clínicos y de la biopsia de arteria ...
Fiabilidad de los predictores clínicos y de la biopsia de arteria ...
Fiabilidad de los predictores clínicos y de la biopsia de arteria ...
You also want an ePaper? Increase the reach of your titles
YUMPU automatically turns print PDFs into web optimized ePapers that Google loves.
<strong>Fiabilidad</strong> <strong>de</strong> <strong>los</strong> <strong>predictores</strong> <strong>clínicos</strong> y <strong>de</strong> <strong>la</strong> <strong>biopsia</strong> <strong>de</strong> <strong>arteria</strong> temporal en el diagnóstico <strong>de</strong> <strong>la</strong> arteritis <strong>de</strong> célu<strong>la</strong>s gigantes<br />
Joan Brunsó Casel<strong>la</strong>s<br />
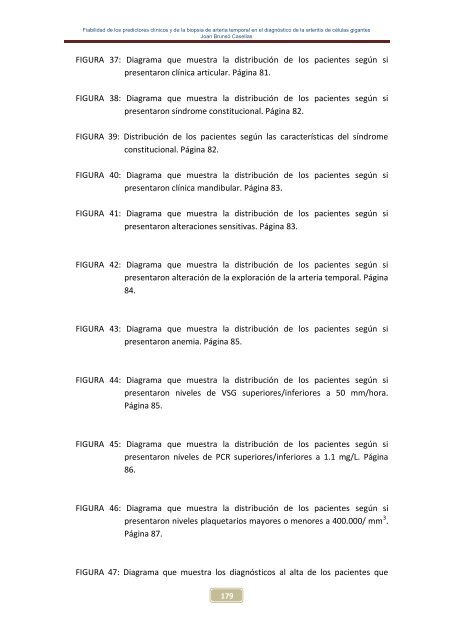
FIGURA 37: Diagrama que muestra <strong>la</strong> distribución <strong>de</strong> <strong>los</strong> pacientes según si<br />
presentaron clínica articu<strong>la</strong>r. Página 81.<br />
FIGURA 38: Diagrama que muestra <strong>la</strong> distribución <strong>de</strong> <strong>los</strong> pacientes según si<br />
presentaron síndrome constitucional. Página 82.<br />
FIGURA 39: Distribución <strong>de</strong> <strong>los</strong> pacientes según <strong>la</strong>s características <strong>de</strong>l síndrome<br />
constitucional. Página 82.<br />
FIGURA 40: Diagrama que muestra <strong>la</strong> distribución <strong>de</strong> <strong>los</strong> pacientes según si<br />
presentaron clínica mandibu<strong>la</strong>r. Página 83.<br />
FIGURA 41: Diagrama que muestra <strong>la</strong> distribución <strong>de</strong> <strong>los</strong> pacientes según si<br />
presentaron alteraciones sensitivas. Página 83.<br />
FIGURA 42: Diagrama que muestra <strong>la</strong> distribución <strong>de</strong> <strong>los</strong> pacientes según si<br />
presentaron alteración <strong>de</strong> <strong>la</strong> exploración <strong>de</strong> <strong>la</strong> <strong>arteria</strong> temporal. Página<br />
84.<br />
FIGURA 43: Diagrama que muestra <strong>la</strong> distribución <strong>de</strong> <strong>los</strong> pacientes según si<br />
presentaron anemia. Página 85.<br />
FIGURA 44: Diagrama que muestra <strong>la</strong> distribución <strong>de</strong> <strong>los</strong> pacientes según si<br />
presentaron niveles <strong>de</strong> VSG superiores/inferiores a 50 mm/hora.<br />
Página 85.<br />
FIGURA 45: Diagrama que muestra <strong>la</strong> distribución <strong>de</strong> <strong>los</strong> pacientes según si<br />
presentaron niveles <strong>de</strong> PCR superiores/inferiores a 1.1 mg/L. Página<br />
86.<br />
FIGURA 46: Diagrama que muestra <strong>la</strong> distribución <strong>de</strong> <strong>los</strong> pacientes según si<br />
presentaron niveles p<strong>la</strong>quetarios mayores o menores a 400.000/ mm 3 .<br />
Página 87.<br />
FIGURA 47: Diagrama que muestra <strong>los</strong> diagnósticos al alta <strong>de</strong> <strong>los</strong> pacientes que<br />
179


