Fiabilidad de los predictores clínicos y de la biopsia de arteria ...
Fiabilidad de los predictores clínicos y de la biopsia de arteria ...
Fiabilidad de los predictores clínicos y de la biopsia de arteria ...

Create successful ePaper yourself
Turn your PDF publications into a flip-book with our unique Google optimized e-Paper software.
<strong>Fiabilidad</strong> <strong>de</strong> <strong>los</strong> <strong>predictores</strong> <strong>clínicos</strong> y <strong>de</strong> <strong>la</strong> <strong>biopsia</strong> <strong>de</strong> <strong>arteria</strong> temporal en el diagnóstico <strong>de</strong> <strong>la</strong> arteritis <strong>de</strong> célu<strong>la</strong>s gigantes<br />
Joan Brunsó Casel<strong>la</strong>s<br />
99<br />
[95% Confi<strong>de</strong>nce Interval]<br />
---------------------------------------------------------------------------<br />
Prevalence Pr(A) 21% 17% 25.5%<br />
---------------------------------------------------------------------------<br />
Sensitivity Pr(+|A) 26.8% 16.9% 38.6%<br />
Specificity Pr(-|N) 96.7% 93.8% 98.5%<br />
ROC area (Sens. + Spec.)/2 .617 .564 .67<br />
---------------------------------------------------------------------------<br />
Likelihood ratio (+) Pr(+|A)/Pr(+|N) 8.06 3.81 17<br />
Likelihood ratio (-) Pr(-|A)/Pr(-|N) .758 .657 .873<br />
Odds ratio LR(+)/LR(-) 10.6 4.63 24.4<br />
Positive predictive value Pr(A|+) 67.9% 47.6% 84.1%<br />
Negative predictive value Pr(N|-) 83.4% 78.9% 87.4%<br />
---------------------------------------------------------------------------<br />
También es un conjunto <strong>de</strong> signos con gran especificidad. Comparte con <strong>la</strong> clínica<br />
mandibu<strong>la</strong>r una baja prevalencia: solo se i<strong>de</strong>ntificó en el 8.18% <strong>de</strong> <strong>los</strong> casos (fig.54).<br />
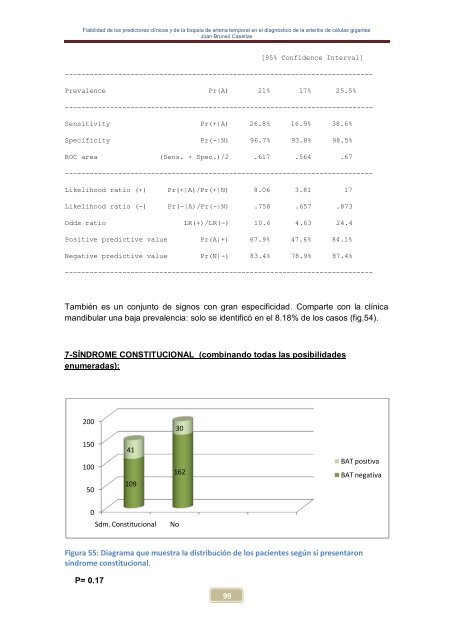
7-SÍNDROME CONSTITUCIONAL (combinando todas <strong>la</strong>s posibilida<strong>de</strong>s<br />
enumeradas):<br />
200<br />
150<br />
100<br />
50<br />
0<br />
Figura 55: Diagrama que muestra <strong>la</strong> distribución <strong>de</strong> <strong>los</strong> pacientes según si presentaron<br />
síndrome constitucional.<br />
P= 0.17<br />
41<br />
109<br />
Sdm. Constitucional No<br />
30<br />
162<br />
BAT positiva<br />
BAT negativa