Fiabilidad de los predictores clínicos y de la biopsia de arteria ...
Fiabilidad de los predictores clínicos y de la biopsia de arteria ...
Fiabilidad de los predictores clínicos y de la biopsia de arteria ...

You also want an ePaper? Increase the reach of your titles
YUMPU automatically turns print PDFs into web optimized ePapers that Google loves.
<strong>Fiabilidad</strong> <strong>de</strong> <strong>los</strong> <strong>predictores</strong> <strong>clínicos</strong> y <strong>de</strong> <strong>la</strong> <strong>biopsia</strong> <strong>de</strong> <strong>arteria</strong> temporal en el diagnóstico <strong>de</strong> <strong>la</strong> arteritis <strong>de</strong> célu<strong>la</strong>s gigantes<br />
Joan Brunsó Casel<strong>la</strong>s<br />
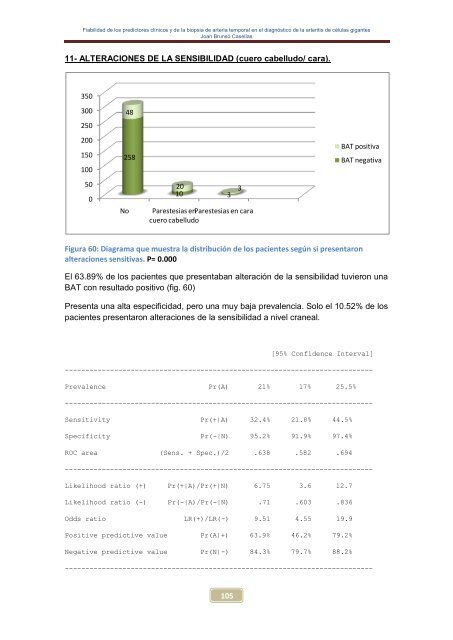
11- ALTERACIONES DE LA SENSIBILIDAD (cuero cabelludo/ cara).<br />
350<br />
300<br />
250<br />
200<br />
150<br />
100<br />
50<br />
0<br />
48<br />
258<br />
20 3<br />
10 3<br />
No Parestesias en Parestesias en cara<br />
cuero cabelludo<br />
Figura 60: Diagrama que muestra <strong>la</strong> distribución <strong>de</strong> <strong>los</strong> pacientes según si presentaron<br />
alteraciones sensitivas. P= 0.000<br />
El 63.89% <strong>de</strong> <strong>los</strong> pacientes que presentaban alteración <strong>de</strong> <strong>la</strong> sensibilidad tuvieron una<br />
BAT con resultado positivo (fig. 60)<br />
Presenta una alta especificidad, pero una muy baja prevalencia. Solo el 10.52% <strong>de</strong> <strong>los</strong><br />
pacientes presentaron alteraciones <strong>de</strong> <strong>la</strong> sensibilidad a nivel craneal.<br />
105<br />
[95% Confi<strong>de</strong>nce Interval]<br />
---------------------------------------------------------------------------<br />
Prevalence Pr(A) 21% 17% 25.5%<br />
---------------------------------------------------------------------------<br />
Sensitivity Pr(+|A) 32.4% 21.8% 44.5%<br />
Specificity Pr(-|N) 95.2% 91.9% 97.4%<br />
ROC area (Sens. + Spec.)/2 .638 .582 .694<br />
---------------------------------------------------------------------------<br />
Likelihood ratio (+) Pr(+|A)/Pr(+|N) 6.75 3.6 12.7<br />
Likelihood ratio (-) Pr(-|A)/Pr(-|N) .71 .603 .836<br />
Odds ratio LR(+)/LR(-) 9.51 4.55 19.9<br />
Positive predictive value Pr(A|+) 63.9% 46.2% 79.2%<br />
Negative predictive value Pr(N|-) 84.3% 79.7% 88.2%<br />
BAT positiva<br />
BAT negativa<br />
---------------------------------------------------------------------------