Fiabilidad de los predictores clínicos y de la biopsia de arteria ...
Fiabilidad de los predictores clínicos y de la biopsia de arteria ...
Fiabilidad de los predictores clínicos y de la biopsia de arteria ...

Create successful ePaper yourself
Turn your PDF publications into a flip-book with our unique Google optimized e-Paper software.
<strong>Fiabilidad</strong> <strong>de</strong> <strong>los</strong> <strong>predictores</strong> <strong>clínicos</strong> y <strong>de</strong> <strong>la</strong> <strong>biopsia</strong> <strong>de</strong> <strong>arteria</strong> temporal en el diagnóstico <strong>de</strong> <strong>la</strong> arteritis <strong>de</strong> célu<strong>la</strong>s gigantes<br />
Joan Brunsó Casel<strong>la</strong>s<br />
[95% Confi<strong>de</strong>nce Interval]<br />
---------------------------------------------------------------------------<br />
Prevalence Pr(A) 21% 17% 25.5%<br />
---------------------------------------------------------------------------<br />
Sensitivity Pr(+|A) 95.8% 88.1% 99.1%<br />
Specificity Pr(-|N) 27.7% 22.4% 33.4%<br />
ROC area (Sens. + Spec.)/2 .617 .582 .653<br />
---------------------------------------------------------------------------<br />
Likelihood ratio (+) Pr(+|A)/Pr(+|N) 1.32 1.21 1.45<br />
Likelihood ratio (-) Pr(-|A)/Pr(-|N) .153 .0496 .47<br />
Odds ratio LR(+)/LR(-) 8.67 2.8 26.8<br />
Positive predictive value Pr(A|+) 25.8% 20.6% 31.5%<br />
Negative predictive value Pr(N|-) 96.2% 89.2% 99.2%<br />
--------------------------------------------------------------------------<br />
Se observa (por el área bajo <strong>la</strong> curva ROC) que <strong>la</strong> VSG categorizada con 50 mm/hora<br />
como punto <strong>de</strong> corte, SÍ tiene capacidad discriminativa global.<br />
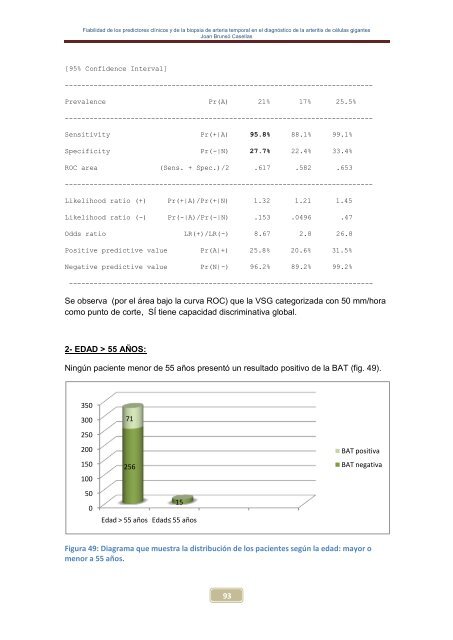
2- EDAD > 55 AÑOS:<br />
Ningún paciente menor <strong>de</strong> 55 años presentó un resultado positivo <strong>de</strong> <strong>la</strong> BAT (fig. 49).<br />
350<br />
300<br />
250<br />
200<br />
150<br />
100<br />
50<br />
0<br />
71<br />
256<br />
15<br />
Edad > 55 años Edad≤ 55 años<br />
Figura 49: Diagrama que muestra <strong>la</strong> distribución <strong>de</strong> <strong>los</strong> pacientes según <strong>la</strong> edad: mayor o<br />
menor a 55 años.<br />
93<br />
BAT positiva<br />
BAT negativa