Fiabilidad de los predictores clínicos y de la biopsia de arteria ...
Fiabilidad de los predictores clínicos y de la biopsia de arteria ...
Fiabilidad de los predictores clínicos y de la biopsia de arteria ...

You also want an ePaper? Increase the reach of your titles
YUMPU automatically turns print PDFs into web optimized ePapers that Google loves.
<strong>Fiabilidad</strong> <strong>de</strong> <strong>los</strong> <strong>predictores</strong> <strong>clínicos</strong> y <strong>de</strong> <strong>la</strong> <strong>biopsia</strong> <strong>de</strong> <strong>arteria</strong> temporal en el diagnóstico <strong>de</strong> <strong>la</strong> arteritis <strong>de</strong> célu<strong>la</strong>s gigantes<br />
Joan Brunsó Casel<strong>la</strong>s<br />
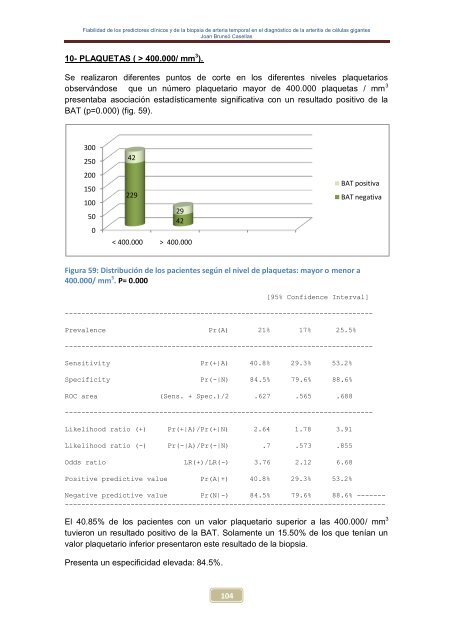
10- PLAQUETAS ( > 400.000/ mm 3 ).<br />
Se realizaron diferentes puntos <strong>de</strong> corte en <strong>los</strong> diferentes niveles p<strong>la</strong>quetarios<br />
observándose que un número p<strong>la</strong>quetario mayor <strong>de</strong> 400.000 p<strong>la</strong>quetas / mm 3<br />
presentaba asociación estadísticamente significativa con un resultado positivo <strong>de</strong> <strong>la</strong><br />
BAT (p=0.000) (fig. 59).<br />
300<br />
250<br />
200<br />
150<br />
100<br />
50<br />
0<br />
42<br />
229<br />
29<br />
42<br />
< 400.000 > 400.000<br />
Figura 59: Distribución <strong>de</strong> <strong>los</strong> pacientes según el nivel <strong>de</strong> p<strong>la</strong>quetas: mayor o menor a<br />
400.000/ mm 3 . P= 0.000<br />
104<br />
[95% Confi<strong>de</strong>nce Interval]<br />
---------------------------------------------------------------------------<br />
Prevalence Pr(A) 21% 17% 25.5%<br />
---------------------------------------------------------------------------<br />
Sensitivity Pr(+|A) 40.8% 29.3% 53.2%<br />
Specificity Pr(-|N) 84.5% 79.6% 88.6%<br />
ROC area (Sens. + Spec.)/2 .627 .565 .688<br />
---------------------------------------------------------------------------<br />
Likelihood ratio (+) Pr(+|A)/Pr(+|N) 2.64 1.78 3.91<br />
Likelihood ratio (-) Pr(-|A)/Pr(-|N) .7 .573 .855<br />
Odds ratio LR(+)/LR(-) 3.76 2.12 6.68<br />
Positive predictive value Pr(A|+) 40.8% 29.3% 53.2%<br />
Negative predictive value Pr(N|-) 84.5% 79.6% 88.6% -------<br />
------------------------------------------------------------------------------<br />
El 40.85% <strong>de</strong> <strong>los</strong> pacientes con un valor p<strong>la</strong>quetario superior a <strong>la</strong>s 400.000/ mm 3<br />
tuvieron un resultado positivo <strong>de</strong> <strong>la</strong> BAT. So<strong>la</strong>mente un 15.50% <strong>de</strong> <strong>los</strong> que tenían un<br />
valor p<strong>la</strong>quetario inferior presentaron este resultado <strong>de</strong> <strong>la</strong> <strong>biopsia</strong>.<br />
Presenta un especificidad elevada: 84.5%.<br />
BAT positiva<br />
BAT negativa