Untitled - Główny Urząd Statystyczny
Untitled - Główny Urząd Statystyczny
Untitled - Główny Urząd Statystyczny

Create successful ePaper yourself
Turn your PDF publications into a flip-book with our unique Google optimized e-Paper software.
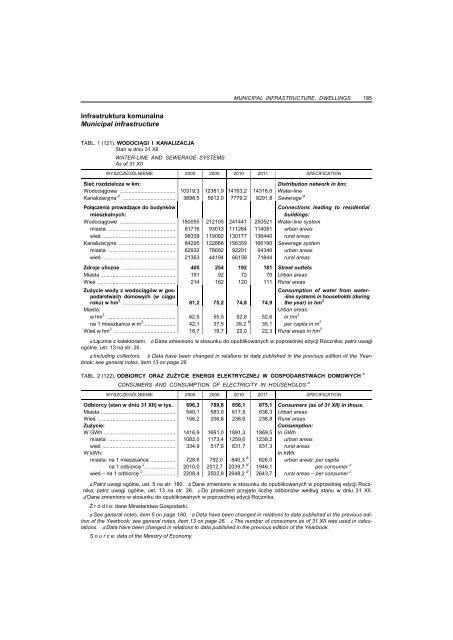
Infrastruktura komunalna<br />
Municipal infrastructure<br />
TABL. 1 (121). WODOCIĄGI I KANALIZACJA<br />
Stan w dniu 31 XII<br />
WATER-LINE AND SEWERAGE SYSTEMS<br />
As of 31 XII<br />
MUNICIPAL INFRASTRUCTURE. DWELLINGS 185<br />
WYSZCZEGÓLNIENIE 2000 2005 2010 2011 SPECIFICATION<br />
Sieć rozdzielcza w km: Distribution network in km:<br />
Wodociągowa ...................................... 10319,3 12381,9 14163,2 14316,0 Water-line<br />
Kanalizacyjna a .................................... 3698,5 5612,0 7779,2 8291,8 Sewerage a<br />
Połączenia prowadzące do budynków<br />
Connections leading to residential<br />
mieszkalnych:<br />
buildings:<br />
Wodociągowe ...................................... 180055 212105 241441 250521 Water-line system<br />
miasta .............................................. 81716 93013 111264 114081 urban areas<br />
wieś .................................................. 98339 119092 130177 136440 rural areas<br />
Kanalizacyjne ....................................... 84295 122886 158359 166190 Sewerage system<br />
miasta .............................................. 62932 78692 92201 94346 urban areas<br />
wieś .................................................. 21363 44194 66158 71844 rural areas<br />
Zdroje uliczne ..................................... 405 254 192 181 Street outlets<br />
Miasta ................................................... 191 92 72 70 Urban areas<br />
Wieś ..................................................... 214 162 120 111 Rural areas<br />
Zużycie wody z wodociągów w gospodarstwach<br />
domowych (w ciągu<br />
roku) w hm 3 .................................... 81,2 75,2 74,8 74,9<br />
Miasta: Urban areas:<br />
w hm 3 .................................................. 62,5 55,5 52,8 52,6 in hm 3<br />
na 1 mieszkańca w m 3 ..................... 42,1 37,5 35,2 b 35,1 per capita in m 3<br />
Wieś w hm 3 .......................................... 18,7 19,7 22,0<br />
3<br />
22,3 Rural areas in hm<br />
Consumption of water from water-<br />
-line systems in households (during<br />
the year) in hm 3<br />
a Łącznie z kolektorami. b Dane zmieniono w stosunku do opublikowanych w poprzedniej edycji Rocznika; patrz uwagi<br />
ogólne, ust. 13 na str. 26.<br />
a Including collectors. b Data have been changed in relations to data published in the previous edition of the Yearbook;<br />
see general notes, item 13 on page 26.<br />
TABL. 2 (122). ODBIORCY ORAZ ZUŻYCIE ENERGII ELEKTRYCZNEJ W GOSPODARSTWACH DOMOWYCH a<br />
CONSUMERS AND CONSUMPTION OF ELECTRICITY IN HOUSEHOLDS a<br />
WYSZCZEGÓLNIENIE 2000 2005 2010 2011 SPECIFICATION<br />
Odbiorcy (stan w dniu 31 XII) w tys. 696,3 789,8 856,1 875,1 Consumers (as of 31 XII) in thous.<br />
Miasta ................................................... 540,1 583,0 617,5 636,3 Urban areas<br />
Wieś ..................................................... 156,2 206,8 238,6 238,8 Rural areas<br />
Zużycie: Consumption:<br />
W GWh ................................................. 1416,9 1691,0 1891,3 1869,5 In GWh<br />
miasta .............................................. 1082,0 1173,4 1259,6 1238,2 urban areas<br />
wieś .................................................. 334,9 517,6 631,7 631,3 rural areas<br />
W kWh: In kWh:<br />
miasta: na 1 mieszkańca ................. 728,6 792,0 840,3 b 826,0 urban areas: per capita<br />
na 1 odbiorcę c ..................... 2010,0 2012,7 2039,7 d 1946,1 per consumer c<br />
wieś – na 1 odbiorcę c ...................... 2208,4 2502,8 2648,2 d 2643,7 rural areas – per consumer c<br />
a Patrz uwagi ogólne, ust. 5 na str. 180. b Dane zmieniono w stosunku do opublikowanych w poprzedniej edycji Rocznika;<br />
patrz uwagi ogólne, ust. 13 na str. 26. c Do przeliczeń przyjęto liczbę odbiorców według stanu w dniu 31 XII.<br />
d Dane zmieniono w stosunku do opublikowanych w poprzedniej edycji Rocznika.<br />
Ź r ó d ł o: dane Ministerstwa Gospodarki.<br />
a See general notes, item 5 on page 180. b Data have been changed in relations to data published in the previous edition<br />
of the Yearbook; see general notes, item 13 on page 26. c The number of consumers as of 31 XII was used in calculations.<br />
d Data have been changed in relations to data published in the previous edition of the Yearbook.<br />
S o u r c e: data of the Ministry of Economy.