Untitled - Główny Urząd Statystyczny
Untitled - Główny Urząd Statystyczny
Untitled - Główny Urząd Statystyczny

You also want an ePaper? Increase the reach of your titles
YUMPU automatically turns print PDFs into web optimized ePapers that Google loves.
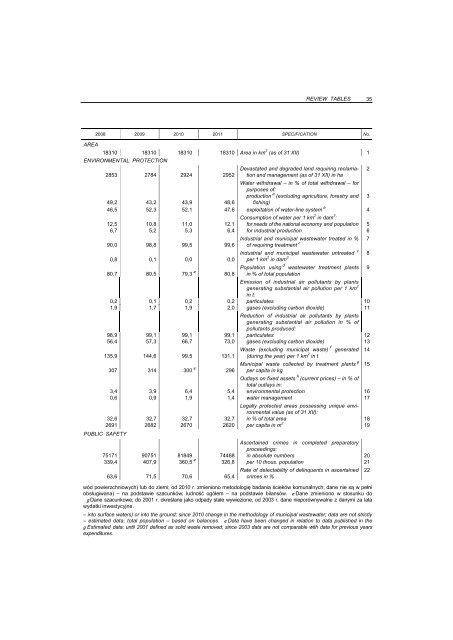
REVIEW TABLES 35<br />
2008 2009 2010 2011 SPECIFICATION No.<br />
AREA<br />
18310 18310 18310 18310 Area in km 2 (as of 31 XII) 1<br />
ENVIRONMENTAL PROTECTION<br />
Devastated and degraded land requiring reclama- 2<br />
2853 2784 2924 2952 tion and management (as of 31 XII) in ha<br />
Water withdrawal – in % of total withdrawal – for<br />
purposes of:<br />
production<br />
49,2 43,2 43,9 48,6<br />
a (excluding agriculture, forestry and 3<br />
fishing)<br />
46,5 52,3 52,1 47,6 exploitation of water-line system b 4<br />
Consumption of water per 1 km 2 in dam 3 :<br />
12,5 10,8 11,0 12,1 for needs of the national economy and population 5<br />
6,7 5,2 5,3 6,4 for industrial production 6<br />
90,0 98,8 99,5 99,6<br />
Industrial and municipal wastewater treated in %<br />
of requiring treatment c<br />
7<br />
Industrial and municipal wastewater untreated<br />
0,8 0,1 0,0 0,0<br />
c<br />
per 1 km 2 in dam 3<br />
8<br />
80,7 80,5 79,3 e Population using<br />
80,8<br />
d wastewater treatment plants 9<br />
in % of total population<br />
Emission of industrial air pollutants by plants<br />
generating substantial air pollution per 1 km 2<br />
in t:<br />
0,2 0,1 0,2 0,2 particulates 10<br />
1,9 1,7 1,9 2,0 gases (excluding carbon dioxide)<br />
Reduction of industrial air pollutants by plants<br />
generating substantial air pollution in % of<br />
pollutants produced:<br />
11<br />
98,9 99,1 99,1 99,1 particulates 12<br />
56,4 57,3 66,7 73,0 gases (excluding carbon dioxide) 13<br />
135,9 144,6 99,5 131,1<br />
Waste (excluding municipal waste) f generated<br />
(during the year) per 1 km 2 14<br />
in t<br />
307 314 300 e 296<br />
Municipal waste collected by treatment plants g<br />
15<br />
per capita in kg<br />
Outlays on fixed assets h (current prices) – in % of<br />
total outlays in:<br />
3,4 3,9 6,4 5,4 environmental protection 16<br />
0,6 0,9 1,9 1,4 water management<br />
Legally protected areas possessing unique environmental<br />
value (as of 31 XII):<br />
17<br />
32,6 32,7 32,7 32,7 in % of total area 18<br />
2691 2682 2670 2620 per capita in m 2 PUBLIC SAFETY<br />
Ascertained crimes in completed preparatory<br />
proceedings:<br />
19<br />
75171 90751 81849 74488 in absolute numbers 20<br />
339,4 407,9 360,5 e 326,8 per 10 thous. population 21<br />
Rate of detectability of delinquents in ascertained 22<br />
63,6 71,5 70,6 65,4 crimes in %<br />
wód powierzchniowych) lub do ziemi; od 2010 r. zmieniono metodologię badania ścieków komunalnych; dane nie są w pełni<br />
obsługiwana) – na podstawie szacunków; ludność ogółem – na podstawie bilansów. e Dane zmieniono w stosunku do<br />
g Dane szacunkowe; do 2001 r. określane jako odpady stałe wywiezione; od 2003 r. dane nieporównywalne z danymi za lata<br />
wydatki inwestycyjne.<br />
– into surface waters) or into the ground; since 2010 change in the methodology of municipal wastewater; data are not strictly<br />
– estimated data; total population – based on balances. e Data have been changed in relation to data published in the<br />
g Estimated data; until 2001 defined as solid waste removed; since 2003 data are not comparable with data for previous years<br />
expenditures.