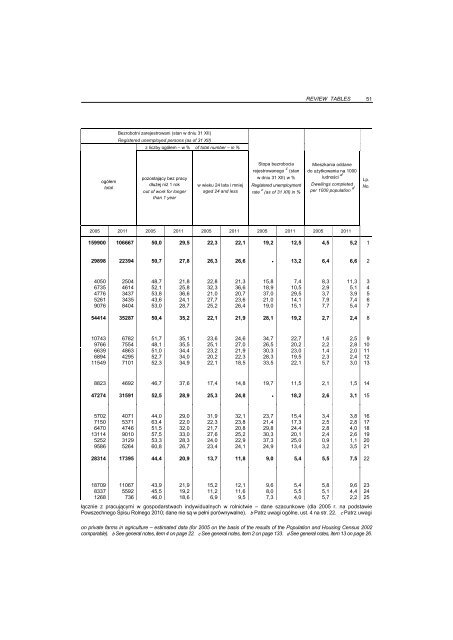
ogółem total Bezrobotni zarejestrowani (stan w dniu 31 XII) Registered unemployed persons (as of 31 XII) z liczby ogółem – w % of total number – in % pozostający bez pracy dłużej niż 1 rok out of work for longer than 1 year w wieku 24 lata i mniej aged 24 and less Stopa bezrobocia rejestrowanego c (stan w dniu 31 XII) w % Registered unemployment rate c (as of 31 XII) in % REVIEW TABLES Mieszkania oddane do użytkowania na 1000 ludności d Dwellings completed per 1000 population d 2005 2011 2005 2011 2005 2011 2005 2011 2005 2011 159900 106667 50,0 29,5 22,3 22,1 19,2 12,5 4,5 5,2 1 29898 22394 50,7 27,8 26,3 26,6 • 13,2 6,4 6,6 2 4050 2504 48,7 21,8 22,8 21,3 15,8 7,4 8,3 11,3 3 6735 4614 52,1 25,8 32,3 36,6 18,9 10,5 2,9 5,1 4 4776 3437 53,8 36,6 21,0 20,7 37,0 29,5 3,7 3,9 5 5261 3435 43,6 24,1 27,7 23,6 21,0 14,1 7,9 7,4 6 9076 8404 53,0 28,7 25,2 26,4 19,0 15,1 7,7 5,4 7 54414 35287 50,4 35,2 22,1 21,9 28,1 19,2 2,7 2,4 8 10743 6782 51,7 35,1 23,6 24,6 34,7 22,7 1,6 2,5 9 9766 7554 48,1 35,5 25,1 27,0 26,5 20,2 2,2 2,8 10 6639 4863 51,0 34,4 23,2 21,9 30,3 23,0 1,4 2,0 11 6894 4295 52,7 34,0 20,2 22,3 28,3 19,5 2,3 2,4 12 11549 7101 52,3 34,9 22,1 18,5 33,5 22,1 5,7 3,0 13 8823 4692 46,7 37,6 17,4 14,8 19,7 11,5 2,1 1,5 14 47274 31591 52,5 28,9 25,3 24,8 • 18,2 2,6 3,1 15 5702 4071 44,0 29,0 31,9 32,1 23,7 15,4 3,4 3,8 16 7150 5371 63,4 22,0 22,3 23,8 21,4 17,3 2,5 2,8 17 6470 4746 51,5 32,0 21,7 20,8 29,8 24,4 2,8 4,0 18 13114 9010 57,5 33,0 27,6 25,2 30,3 20,1 2,4 2,6 19 5252 3129 53,3 28,3 24,0 22,9 37,3 25,0 0,9 1,1 20 9586 5264 60,8 26,7 23,4 24,1 24,9 13,4 3,2 3,5 21 28314 17395 44,4 20,9 13,7 11,8 9,0 5,4 5,5 7,5 22 18709 11067 43,9 21,9 15,2 12,1 9,6 5,4 5,8 9,6 23 8337 5592 45,5 19,2 11,2 11,6 8,0 5,5 5,1 4,4 24 1268 736 46,0 18,6 6,9 9,5 7,3 4,0 5,7 2,2 25 łącznie z pracującymi w gospodarstwach indywidualnych w rolnictwie – dane szacunkowe (dla 2005 r. na podstawie Powszechnego Spisu Rolnego 2010; dane nie są w pełni porównywalne). b Patrz uwagi ogólne, ust. 4 na str. 22. c Patrz uwagi on private farms in agriculture – estimated data (for 2005 on the basis of the results of the Population and Housing Census 2002 comparable). b See general notes, item 4 on page 22. c See general notes, item 2 on page 133. d See general notes, item 13 on page 26. 51 Lp. No.
52 TABLICE PRZEGLĄDOWE III. WYBRANE DANE O PODREGIONACH (NTS 3) I POWIATACH (NTS 4) (dok.) SELECTED DATA BY SUBREGIONS (NTS 3) AND POWIATS (NTS 4) (cont.) Produkcja sprzedana przemysłu a (ceny bieżące) Sold production of industry a Nakłady inwestycyjne w przedsiębiorstwach (current prices) ab (ceny bieżące) Investment outlays in enterprises ab (current prices) Lp. No. WYSZCZEGÓLNIENIE SPECIFICATION w mln in mln na 1 mieszkańca e w zł per capita e in zl w mln zł in mln zl na 1 mieszkańca e w zł per capita e in zl 2005 2011 2005 2011 2008 2011 2008 2011 1 W O J E W Ó D Z T W O 38505,5 72382,3 17526 31757 8857,9 7478,5 3999 3281 V O I V O D S H I P 2 Podregion gdański ..... Subregion Powiaty: Powiats: 4045,5 6389,1 8424 11909 1005,2 1061,6 2002 1979 3 gdański ..................... 824,7 1490,8 9836 14960 310,9 325,9 3451 3270 4 kartuski ..................... 971,5 1582,3 9008 13144 153,1 174,4 1354 1448 5 nowodworski .............. 105,4 202,6 2963 5547 23,1 41,7 654 1141 6 pucki ......................... 1030,1 1083,4 14023 13611 230,9 238,5 3034 2999 7 wejherowski ............... 1113,8 2030,0 6205 10132 287,2 281,1 1533 1403 8 Podregion słupski ....... Subregion Powiaty: Powiats: 4772,6 6686,2 9989 13636 896,7 922,2 1872 1881 9 bytowski .................... 663,9 1142,4 8809 14609 101,8 91,3 1347 1170 10 chojnicki .................... 855,6 1464,6 9389 15296 128,5 127,7 1390 1332 11 człuchowski ............... 528,1 610,1 9299 10598 109,6 121,6 1925 2116 12 lęborski ..................... 916,9 1006,8 14420 15209 123,4 88,0 1934 1329 13 słupski ........................ 818,5 1102,1 8875 11387 259,7 301,8 2797 3117 Miasto na prawach powiatu: City with powiat status: 14 Słupsk ....................... 989,6 1360,2 10027 14194 173,7 191,8 1784 2001 15 Podregion starogardzki Subregion Powiaty: Powiats: 9638,6 14357,3 19805 28474 1008,3 1220,9 2059 2421 16 kościerski .................. 409,4 649,7 6148 9211 56,0 68,2 829 966 17 kwidzyński ................ 4319,2 4575,4 53458 54684 178,6 217,1 2196 2598 18 malborski .................. 460,3 809,9 7288 12489 201,2 261,8 3216 4037 19 starogardzki .............. 1570,8 2669,7 12913 21065 189,5 253,3 1539 1999 20 sztumski .................... 142,3 255,1 3388 5967 58,7 84,6 1407 1976 21 tczewski .................... 2736,6 5397,5 24326 46660 324,3 335,9 2861 2903 22 Podregion trójmiejski Subregion Miasta na prawach powiatu: Cities with powiat status: 20048,8 44949,7 26650 60078 5947,7 4273,8 7989 5712 23 Gdańsk ..................... 16429,7 41618,2 35810 90389 4776,5 3164,0 10482 6871 24 Gdynia ...................... 3338,7 2951,1 13192 11848 962,1 952,2 3851 3824 25 Sopot ........................ 280,4 380,4 6942 9837 209,1 157,6 5369 4078 a Dane dotyczą podmiotów gospodarczych, w których liczba pracujących przekracza 9 osób; patrz uwagi ogólne, ust. 4 prowadzących gospodarstwa indywidualne w rolnictwie. e Patrz uwagi ogólne, ust. 13 na str. 26. a Data concern economic entities employing more than 9 persons; see general notes, item 4 on page 22. b According in agriculture. e See general notes, item 13 on page 26.
- Page 2 and 3: 2012
- Page 4 and 5: Przedmowa Urząd Statystyczny w Gda
- Page 6 and 7: SPIS RZECZY Przedmowa .............
- Page 8 and 9: Efekty rzeczowe uzyskane w wyniku p
- Page 10 and 11: DZIAŁ VI CHAPTER VI RYNEK PRACY LA
- Page 12 and 13: Komunikacja miejska (2000, 2005, 20
- Page 14 and 15: Wychowanie przedszkolne Pre-primary
- Page 16 and 17: CONTENTS 15 Tabl. Table Str. Page P
- Page 18 and 19: Wahania sezonowe obrotów ładunkow
- Page 20 and 21: DZIAŁ XXIII CHAPTER XXIII PRYWATYZ
- Page 22 and 23: dam 3 = dekametr sześcienny cd. =
- Page 24 and 25: Pod pojęciem „Pozostałe usługi
- Page 26 and 27: 10. Dane w cenach bieżących odpow
- Page 28 and 29: skrót abbreviation pełna nazwa fu
- Page 30 and 31: I. WOJEWÓDZTWO NA TLE KRAJU W 2011
- Page 32 and 33: I. WOJEWÓDZTWO NA TLE KRAJU W 2011
- Page 34 and 35: I. WOJEWÓDZTWO NA TLE KRAJU W 2011
- Page 36 and 37: REVIEW TABLES 35 2008 2009 2010 201
- Page 38 and 39: REVIEW TABLES 37 2008 2009 2010 201
- Page 40 and 41: REVIEW TABLES 39 2008 2009 2010 201
- Page 42 and 43: REVIEW TABLES 41 2008 EDUCATION 200
- Page 44 and 45: REVIEW TABLES 43 2008 2009 2010 201
- Page 46 and 47: REVIEW TABLES 45 2008 2009 2010 201
- Page 48 and 49: REVIEW TABLES 47 2008 2009 2010 201
- Page 50 and 51: Deaths w tym niemowląt na 1000 uro
- Page 54 and 55: Wartość brutto środków trwałyc
- Page 56 and 57: TABL. 3. UKŁAD PIONOWY POWIERZCHNI
- Page 58 and 59: PODZIAŁ ADMINISTRACYJNY WOJEWÓDZT
- Page 60 and 61: DZIAŁ II STAN I OCHRONA ŚRODOWISK
- Page 62 and 63: Jednolita część wód powierzchni
- Page 64 and 65: Dane o oczyszczalniach ścieków ko
- Page 66 and 67: Przez zrekultywowane tereny składo
- Page 68 and 69: Dane dotyczące funduszy ochrony ś
- Page 70 and 71: ENVIRONMENTAL PROTECTION 67 TABL. 4
- Page 72 and 73: ENVIRONMENTAL PROTECTION 69 TABL. 9
- Page 74 and 75: ENVIRONMENTAL PROTECTION 71 TABL. 1
- Page 76 and 77: ENVIRONMENTAL PROTECTION 73 TABL. 1
- Page 78 and 79: TABL. 19 (25). PARKI NARODOWE Stan
- Page 80 and 81: ENVIRONMENTAL PROTECTION 77 TABL. 2
- Page 82 and 83: TABL. 25 (31). FUNDUSZE OCHRONY ŚR
- Page 84 and 85: DZIAŁ III PODZIAŁ ADMINISTRACYJNY
- Page 86 and 87: ADMINISTRATIVE DIVISION AND TERRITO
- Page 88 and 89: ADMINISTRATIVE DIVISION AND TERRITO
- Page 90 and 91: ADMINISTRATIVE DIVISION AND TERRITO
- Page 92 and 93: ADMINISTRATIVE DIVISION AND TERRITO
- Page 94 and 95: ADMINISTRATIVE DIVISION AND TERRITO
- Page 96 and 97: DZIAŁ IV WYMIAR SPRAWIEDLIWOŚCI.
- Page 98 and 99: Informacje o przestępstwach stwier
- Page 100 and 101: TABL. 4 (47). PODMIOTY W KRAJOWYM R
- Page 102 and 103:
JUSTICE. PUBLIC SAFETY TABL. 5 (48)
- Page 104 and 105:
JUSTICE. PUBLIC SAFETY TABL. 6 (49)
- Page 106 and 107:
3. Stan cywilny faktyczny został o
- Page 108 and 109:
niem rehabilitacyjnym, zasiłek dla
- Page 110 and 111:
nych gmin o zameldowaniach osób na
- Page 112 and 113:
TABL. 3 (53). LUDNOŚĆ W WIEKU PRO
- Page 114 and 115:
TABL. 6 (56). GMINY ZAMIESZKANE PRZ
- Page 116 and 117:
TABL. 9 (59). LUDNOŚĆ WEDŁUG GŁ
- Page 118 and 119:
TABL. 14 (64). RUCH NATURALNY LUDNO
- Page 120 and 121:
POPULATION. RELIGIOUS DENOMINATIONS
- Page 122 and 123:
TABL. 21 (71). URODZENIA BIRTHS WYS
- Page 124 and 125:
TABL. 25 (75). ZGONY a WEDŁUG PRZY
- Page 126 and 127:
TABL. 28 (78). ZAMACHY SAMOBÓJCZE
- Page 128 and 129:
POPULATION. RELIGIOUS DENOMINATIONS
- Page 130 and 131:
TABL. 33 (83). NIEKTÓRE WYZNANIA R
- Page 132 and 133:
Do bezrobotnych zaliczono także os
- Page 134 and 135:
2) przeciętnego zatrudnienia praco
- Page 136 and 137:
5) nie podlega ubezpieczeniu emeryt
- Page 138 and 139:
3) pełnienia mandatu posła lub se
- Page 140 and 141:
Aktywność ekonomiczna ludności E
- Page 142 and 143:
LABOUR MARKET TABL. 2 (85). AKTYWNO
- Page 144 and 145:
TABL. 4 (87). PRACUJĄCY a WEDŁUG
- Page 146 and 147:
TABL. 6 (89). PRZECIĘTNE ZATRUDNIE
- Page 148 and 149:
TABL. 8 (91). PRZYJĘCIA DO PRACY a
- Page 150 and 151:
TABL. 9 (92). ZWOLNIENIA Z PRACY a
- Page 152 and 153:
TABL. 11 (94). POPYT NA PRACĘ a St
- Page 154 and 155:
Bezrobocie Unemployment LABOUR MARK
- Page 156 and 157:
LABOUR MARKET TABL. 16 (99). BEZROB
- Page 158 and 159:
LABOUR MARKET TABL. 19 (102). WYDAR
- Page 160 and 161:
TABL. 21 (104). ZATRUDNIENI W WARUN
- Page 162 and 163:
TABL. 22 (105). CHOROBY ZAWODOWE (d
- Page 164 and 165:
LABOUR MARKET TABL. 24 (107). ODSZK
- Page 166 and 167:
- honoraria wypłacone niektórym g
- Page 168 and 169:
Wynagrodzenia Wages and salaries TA
- Page 170 and 171:
TABL. 2 (109). WYNAGRODZENIA BRUTTO
- Page 172 and 173:
WAGES AND SALARIES. SOCIAL SECURITY
- Page 174 and 175:
WAGES AND SALARIES. SOCIAL SECURITY
- Page 176 and 177:
Świadczenia z ubezpieczeń społec
- Page 178 and 179:
LUDNOŚĆ WEDŁUG PŁCI I WIEKU W 2
- Page 180 and 181:
DZIAŁ VIII BUDŻETY GOSPODARSTW DO
- Page 182 and 183:
TABL. 1 (116). GOSPODARSTWA DOMOWE
- Page 184 and 185:
DZIAŁ IX INFRASTRUKTURA KOMUNALNA.
- Page 186 and 187:
Przez linię komunikacyjną rozumie
- Page 188 and 189:
2) gmin (komunalne) - mieszkania st
- Page 190 and 191:
Infrastruktura komunalna Municipal
- Page 192 and 193:
TABL. 6 (126). KOMUNIKACJA MIEJSKA
- Page 194 and 195:
MUNICIPAL INFRASTRUCTURE. DWELLINGS
- Page 196 and 197:
TABL. 15 (135). MIESZKANIA ODDANE D
- Page 198 and 199:
Szkoły wyższe mogą być publiczn
- Page 200 and 201:
15. Szkoły specjalne organizowane
- Page 202 and 203:
TABL. 1 (137). EDUKACJA WEDŁUG SZC
- Page 204 and 205:
EDUCATION TABL. 2 (138). SZKOŁY DL
- Page 206 and 207:
EDUCATION TABL. 4 (140). UCZĄCY SI
- Page 208 and 209:
EDUCATION TABL. 7 (143). SPECJALNE
- Page 210 and 211:
EDUCATION TABL. 11 (147). KOMPUTERY
- Page 212 and 213:
TABL. 13 (149). SZKOŁY PODSTAWOWE
- Page 214 and 215:
EDUCATION TABL. 16 (152). UCZNIOWIE
- Page 216 and 217:
EDUCATION TABL. 22 (158). UCZNIOWIE
- Page 218 and 219:
EDUCATION TABL. 27 (163). UCZNIOWIE
- Page 220 and 221:
EDUCATION TABL. 30 (166). ABSOLWENC
- Page 222 and 223:
Szkoły dla dorosłych Schools for
- Page 224 and 225:
EDUKACJA WEDŁUG SZCZEBLI KSZTAŁCE
- Page 226 and 227:
DZIAŁ XI OCHRONA ZDROWIA I OPIEKA
- Page 228 and 229:
Nr 170, poz. 1797, z późniejszymi
- Page 230 and 231:
15. Dane o domach i zakładach pomo
- Page 232 and 233:
TABL. 3 (173). STACJONARNA OPIEKA Z
- Page 234 and 235:
HEALTH CARE AND SOCIAL WELFARE TABL
- Page 236 and 237:
TABL. 9 (179). ŻŁOBKI Stan w dniu
- Page 238 and 239:
HEALTH CARE AND SOCIAL WELFARE TABL
- Page 240 and 241:
Wśród kin stałych wyróżnia si
- Page 242 and 243:
TABL. 2 (185). MUZEA MUSEUMS WYSZCZ
- Page 244 and 245:
TABL. 6 (189). KINA STAŁE FIXED CI
- Page 246 and 247:
TABL. 8 (191). TURYSTYCZNE OBIEKTY
- Page 248 and 249:
CULTURE AND TOURISM TABL. 11 (194).
- Page 250 and 251:
DZIAŁ XIII NAUKA I TECHNIKA. SPOŁ
- Page 252 and 253:
3) w kategorii pozostały personel
- Page 254 and 255:
w energię elektryczną, gaz, parę
- Page 256 and 257:
SCIENCE AND TECHNOLOGY. INFORMATION
- Page 258 and 259:
SCIENCE AND TECHNOLOGY. INFORMATION
- Page 260 and 261:
SCIENCE AND TECHNOLOGY. INFORMATION
- Page 262 and 263:
TABL. 9 (204). WYNALAZKI I WZORY U
- Page 264 and 265:
TABL. 1 (206). WSKAŹNIKI CEN TOWAR
- Page 266 and 267:
DZIAŁ XV ROLNICTWO I LEŚNICTWO Uw
- Page 268 and 269:
Towarowa produkcja rolnicza stanowi
- Page 270 and 271:
Leśnictwo Forestry AGRICULTURE AND
- Page 272 and 273:
Rolnictwo Agriculture AGRICULTURE A
- Page 274 and 275:
AGRICULTURE AND FORESTRY TABL. 4 (2
- Page 276 and 277:
TABL. 6 (215). ZBIORY I PLONY WYBRA
- Page 278 and 279:
AGRICULTURE AND FORESTRY TABL. 9 (2
- Page 280 and 281:
TABL. 10 (219). BYDŁO, TRZODA CHLE
- Page 282 and 283:
TABL. 14 (223). PRODUKCJA MLEKA, JA
- Page 284 and 285:
TABL. 19 (228). SKUP WAŻNIEJSZYCH
- Page 286 and 287:
AGRICULTURE AND FORESTRY TABL. 21 (
- Page 288 and 289:
TABL. 23 (232). POWIERZCHNIA GRUNT
- Page 290 and 291:
AGRICULTURE AND FORESTRY TABL. 26 (
- Page 292 and 293:
DZIAŁ XVI PRZEMYSŁ I BUDOWNICTWO
- Page 294 and 295:
6. Dane o przeciętnym zatudnieniu
- Page 296 and 297:
INDUSTRY AND CONSTRUCTION TABL. 3 (
- Page 298 and 299:
INDUSTRY AND CONSTRUCTION TABL. 5 (
- Page 300 and 301:
INDUSTRY AND CONSTRUCTION TABL. 8 (
- Page 302 and 303:
INDUSTRY AND CONSTRUCTION TABL. 10
- Page 304 and 305:
STRUKTURA MIESZKAŃ ODDANYCH DO UŻ
- Page 306 and 307:
DZIAŁ XVII TRANSPORT I ŁĄCZNOŚ
- Page 308 and 309:
3. Usługi łączności obejmują u
- Page 310 and 311:
Nie uwzględniają natomiast: statk
- Page 312 and 313:
Do przewozów w zasięgu oceaniczny
- Page 314 and 315:
TRANSPORT AND COMMUNICATIONS. MARIT
- Page 316 and 317:
TABL. 7 (255). WYBRANE DANE O PORCI
- Page 318 and 319:
Gospodarka morska Maritime economy
- Page 320 and 321:
TRANSPORT AND COMMUNICATIONS. MARIT
- Page 322 and 323:
TRANSPORT AND COMMUNICATIONS. MARIT
- Page 324 and 325:
TRANSPORT AND COMMUNICATIONS. MARIT
- Page 326 and 327:
TRANSPORT AND COMMUNICATIONS. MARIT
- Page 328 and 329:
TABL. 26 (274). ZAMÓWIENIA I PRODU
- Page 330 and 331:
TABL. 30 (278). KUTRY WEDŁUG PORT
- Page 332 and 333:
TABL. 34 (282). BIOLOGICZNA ZABUDOW
- Page 334 and 335:
Podziału towarów konsumpcyjnych n
- Page 336 and 337:
TABL. 2 (285). STRUKTURA SPRZEDAŻY
- Page 338 and 339:
DZIAŁ XIX FINANSE PRZEDSIĘBIORSTW
- Page 340 and 341:
FINANCES OF ENTERPRISES - część
- Page 342 and 343:
FINANCES OF ENTERPRISES TABL. 1 (29
- Page 344 and 345:
FINANCES OF ENTERPRISES TABL. 3 (29
- Page 346 and 347:
TABL. 5 (294). BILANS FINANSOWY PRZ
- Page 348 and 349:
TABL. 6 (295). AKTYWA OBROTOWE PRZE
- Page 350 and 351:
TABL. 8 (297). KAPITAŁ ZAKŁADOWY
- Page 352 and 353:
DZIAŁ XX FINANSE PUBLICZNE Uwagi o
- Page 354 and 355:
PUBLIC FINANCE TABL. 1 (299). DOCHO
- Page 356 and 357:
PUBLIC FINANCE TABL. 3 (301). WYDAT
- Page 358 and 359:
DZIAŁ XXI INWESTYCJE. ŚRODKI TRWA
- Page 360 and 361:
2. Wartość brutto środków trwa
- Page 362 and 363:
Inwestycje Investments TABL. 1 (304
- Page 364 and 365:
INVESTMENTS. FIXED ASSETS TABL. 3 (
- Page 366 and 367:
INVESTMENTS. FIXED ASSETS TABL. 5 (
- Page 368 and 369:
INVESTMENTS. FIXED ASSETS TABL. 7 (
- Page 370 and 371:
wszystkie krajowe jednostki instytu
- Page 372 and 373:
TABL. 1 (311). PRODUKT KRAJOWY BRUT
- Page 374 and 375:
SEKTORY INSTYTUCJONALNE I ICH WZAJE
- Page 376 and 377:
DZIAŁ XXIII PRYWATYZACJA. PODMIOTY
- Page 378 and 379:
PRIVATIZATION. ENTITIES OF THE NATI
- Page 380 and 381:
PRIVATIZATION. ENTITIES OF THE NATI
- Page 382 and 383:
PRIVATIZATION. ENTITIES OF THE NATI