Living Image 3.1
Living Image 3.1
Living Image 3.1

You also want an ePaper? Increase the reach of your titles
YUMPU automatically turns print PDFs into web optimized ePapers that Google loves.
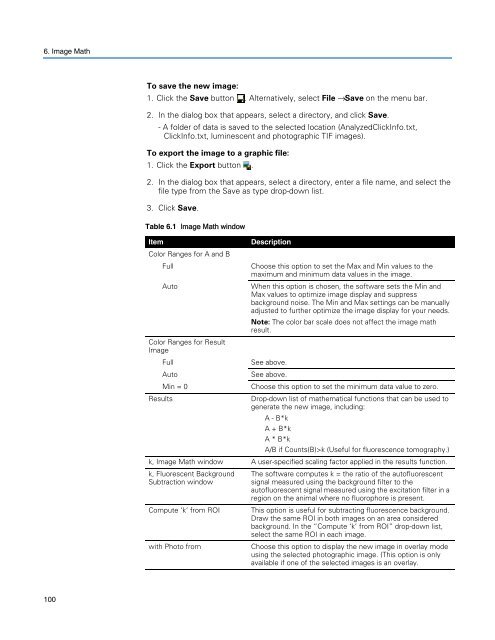
6. <strong>Image</strong> Math<br />
100<br />
To save the new image:<br />
1. Click the Save button . Alternatively, select File → Save on the menu bar.<br />
2. In the dialog box that appears, select a directory, and click Save.<br />
- A folder of data is saved to the selected location (AnalyzedClickInfo.txt,<br />
ClickInfo.txt, luminescent and photographic TIF images).<br />
To export the image to a graphic file:<br />
1. Click the Export button .<br />
2. In the dialog box that appears, select a directory, enter a file name, and select the<br />
file type from the Save as type drop-down list.<br />
3. Click Save.<br />
Table 6.1 <strong>Image</strong> Math window<br />
Item Description<br />
Color Ranges for A and B<br />
Full Choose this option to set the Max and Min values to the<br />
maximum and minimum data values in the image.<br />
Auto When this option is chosen, the software sets the Min and<br />
Max values to optimize image display and suppress<br />
background noise. The Min and Max settings can be manually<br />
adjusted to further optimize the image display for your needs.<br />
Note: The color bar scale does not affect the image math<br />
result.<br />
Color Ranges for Result<br />
<strong>Image</strong><br />
Full See above.<br />
Auto See above.<br />
Min = 0 Choose this option to set the minimum data value to zero.<br />
Results Drop-down list of mathematical functions that can be used to<br />
generate the new image, including:<br />
A - B*k<br />
A + B*k<br />
A * B*k<br />
A/B if Counts(B)>k (Useful for fluorescence tomography.)<br />
k, <strong>Image</strong> Math window A user-specified scaling factor applied in the results function.<br />
k, Fluorescent Background The software computes k = the ratio of the autofluorescent<br />
Subtraction window<br />
signal measured using the background filter to the<br />
autofluorescent signal measured using the excitation filter in a<br />
region on the animal where no fluorophore is present.<br />
Compute ‘k’ from ROI This option is useful for subtracting fluorescence background.<br />
Draw the same ROI in both images on an area considered<br />
background. In the “Compute ‘k’ from ROI” drop-down list,<br />
select the same ROI in each image.<br />
with Photo from Choose this option to display the new image in overlay mode<br />
using the selected photographic image. (This option is only<br />
available if one of the selected images is an overlay.