Living Image 3.1
Living Image 3.1
Living Image 3.1

You also want an ePaper? Increase the reach of your titles
YUMPU automatically turns print PDFs into web optimized ePapers that Google loves.
F. Fluorescent Imaging<br />
Specifying Signal<br />
Levels and f/stop<br />
Settings<br />
F.4 <strong>Image</strong> Data Display<br />
214<br />
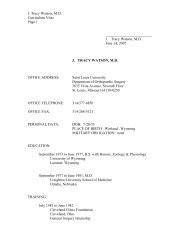
Figure F.6 Illustration of the in vivo fluorescence process.<br />
At 600-900 nm, light transmission through tissue is highest and the generation of<br />
autofluorescence is lower. Therefore it is important to select fluorophores that are active<br />
in the 600-900 nm range. Fluorophores such as GFP that are active in the 450-600 nm<br />
range will still work, but the depth of detection may be limited to within several<br />
millimeters of the surface.<br />
Fluorescent signals are usually brighter than bioluminescent signals, so imaging times are<br />
shorter, typically from one to 30 seconds. The bright signal enables a lower binning level<br />
that produces better spatial resolution. Further, the f/stop can often be set to higher values;<br />
f/2 or f/4 is recommended for fluorescence imaging. A higher f/stop improves the depth<br />
of field, yielding a sharper image. For more details on the f/stop, see Lens Aperture,<br />
page 191.<br />
Fluorescent image data can be displayed in units of counts or photons (absolute,<br />
calibrated), or in terms of efficiency (calibrated, normalized). For more details, see<br />
Quantifying <strong>Image</strong> Data, page 199.<br />
If the image is displayed in photons, you can compare images with different exposure<br />
times, f/stop setting, or binning level. When an image is displayed in terms of efficiency,<br />
the fluorescent image is normalized against a stored reference image of the excitation light<br />
intensity. Efficiency image data is without units and represents the ratio of emitted light<br />
to incident light. For more details on efficiency, see page 201.<br />
Fluorescent Efficiency The detected fluorescent signal depends on the amount of fluorophore present in the<br />
sample and the intensity of the incident excitation light. At the sample stage, the incident<br />
excitation light is not uniform over the FOV. It peaks at the center of the FOV and drops<br />
of slowly toward the edges (Figure F.7). To eliminate the excitation light as a variable from<br />
the measurement, the data can be displayed in terms of efficiency (Figure F.8).