Living Image 3.1
Living Image 3.1
Living Image 3.1
You also want an ePaper? Increase the reach of your titles
YUMPU automatically turns print PDFs into web optimized ePapers that Google loves.
<strong>Living</strong> <strong>Image</strong> ® Software User’s Manual<br />
F.3 Working with Fluorescent Samples<br />
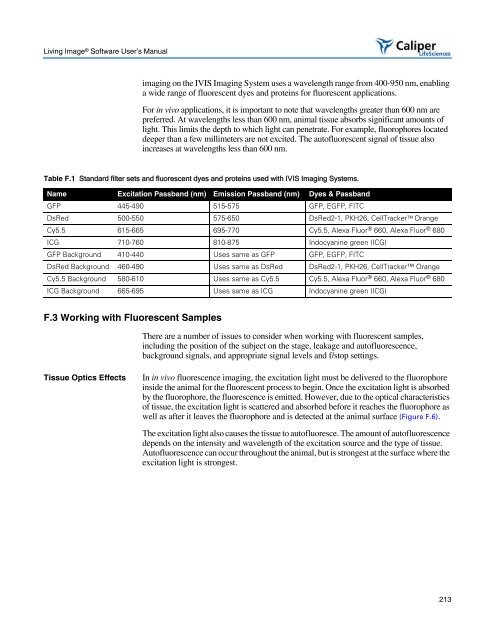
imaging on the IVIS Imaging System uses a wavelength range from 400-950 nm, enabling<br />
a wide range of fluorescent dyes and proteins for fluorescent applications.<br />
For in vivo applications, it is important to note that wavelengths greater than 600 nm are<br />
preferred. At wavelengths less than 600 nm, animal tissue absorbs significant amounts of<br />
light. This limits the depth to which light can penetrate. For example, fluorophores located<br />
deeper than a few millimeters are not excited. The autofluorescent signal of tissue also<br />
increases at wavelengths less than 600 nm.<br />
Table F.1 Standard filter sets and fluorescent dyes and proteins used with IVIS Imaging Systems.<br />
Name Excitation Passband (nm) Emission Passband (nm) Dyes & Passband<br />
GFP 445-490 515-575 GFP, EGFP, FITC<br />
DsRed 500-550 575-650 DsRed2-1, PKH26, CellTracker Orange<br />
Cy5.5 615-665 695-770 Cy5.5, Alexa Fluor ® 660, Alexa Fluor ® 680<br />
ICG 710-760 810-875 Indocyanine green (ICG)<br />
GFP Background 410-440 Uses same as GFP GFP, EGFP, FITC<br />
DsRed Background 460-490 Uses same as DsRed DsRed2-1, PKH26, CellTracker Orange<br />
Cy5.5 Background 580-610 Uses same as Cy5.5 Cy5.5, Alexa Fluor ® 660, Alexa Fluor ® 680<br />
ICG Background 665-695 Uses same as ICG Indocyanine green (ICG)<br />
There are a number of issues to consider when working with fluorescent samples,<br />
including the position of the subject on the stage, leakage and autofluorescence,<br />
background signals, and appropriate signal levels and f/stop settings.<br />
Tissue Optics Effects In in vivo fluorescence imaging, the excitation light must be delivered to the fluorophore<br />
inside the animal for the fluorescent process to begin. Once the excitation light is absorbed<br />
by the fluorophore, the fluorescence is emitted. However, due to the optical characteristics<br />
of tissue, the excitation light is scattered and absorbed before it reaches the fluorophore as<br />
well as after it leaves the fluorophore and is detected at the animal surface (Figure F.6).<br />
The excitation light also causes the tissue to autofluoresce. The amount of autofluorescence<br />
depends on the intensity and wavelength of the excitation source and the type of tissue.<br />
Autofluorescence can occur throughout the animal, but is strongest at the surface where the<br />
excitation light is strongest.<br />
213


