Living Image 3.1
Living Image 3.1
Living Image 3.1

Create successful ePaper yourself
Turn your PDF publications into a flip-book with our unique Google optimized e-Paper software.
7. Planar Spectral <strong>Image</strong> Analysis<br />
108<br />
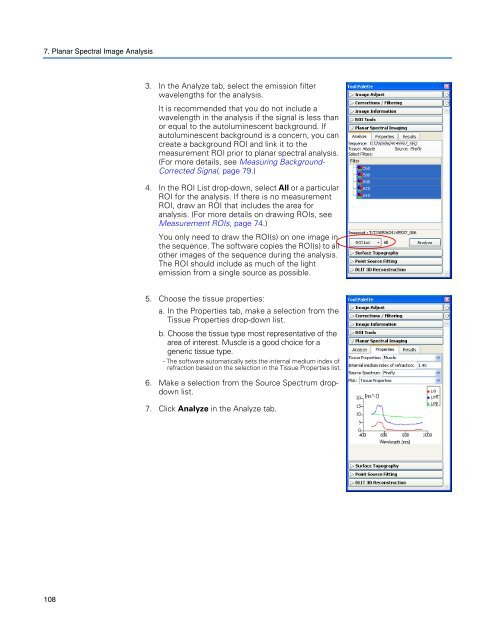
3. In the Analyze tab, select the emission filter<br />
wavelengths for the analysis.<br />
It is recommended that you do not include a<br />
wavelength in the analysis if the signal is less than<br />
or equal to the autoluminescent background. If<br />
autoluminescent background is a concern, you can<br />
create a background ROI and link it to the<br />
measurement ROI prior to planar spectral analysis.<br />
(For more details, see Measuring Background-<br />
Corrected Signal, page 79.)<br />
4. In the ROI List drop-down, select All or a particular<br />
ROI for the analysis. If there is no measurement<br />
ROI, draw an ROI that includes the area for<br />
analysis. (For more details on drawing ROIs, see<br />
Measurement ROIs, page 74.)<br />
You only need to draw the ROI(s) on one image in<br />
the sequence. The software copies the ROI(s) to all<br />
other images of the sequence during the analysis.<br />
The ROI should include as much of the light<br />
emission from a single source as possible.<br />
5. Choose the tissue properties:<br />
a. In the Properties tab, make a selection from the<br />
Tissue Properties drop-down list.<br />
b. Choose the tissue type most representative of the<br />
area of interest. Muscle is a good choice for a<br />
generic tissue type.<br />
- The software automatically sets the internal medium index of<br />
refraction based on the selection in the Tissue Properties list.<br />
6. Make a selection from the Source Spectrum dropdown<br />
list.<br />
7. Click Analyze in the Analyze tab.