Living Image 3.1
Living Image 3.1
Living Image 3.1

Create successful ePaper yourself
Turn your PDF publications into a flip-book with our unique Google optimized e-Paper software.
7. Planar Spectral <strong>Image</strong> Analysis<br />
110<br />
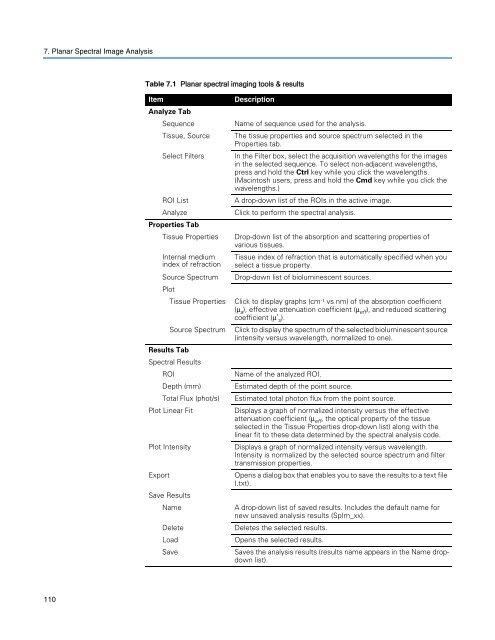
Table 7.1 Planar spectral imaging tools & results<br />
Item Description<br />
Analyze Tab<br />
Sequence Name of sequence used for the analysis.<br />
Tissue, Source The tissue properties and source spectrum selected in the<br />
Properties tab.<br />
Select Filters In the Filter box, select the acquisition wavelengths for the images<br />
in the selected sequence. To select non-adjacent wavelengths,<br />
press and hold the Ctrl key while you click the wavelengths.<br />
(Macintosh users, press and hold the Cmd key while you click the<br />
wavelengths.)<br />
ROI List A drop-down list of the ROIs in the active image.<br />
Analyze Click to perform the spectral analysis.<br />
Properties Tab<br />
Tissue Properties Drop-down list of the absorption and scattering properties of<br />
various tissues.<br />
Internal medium Tissue index of refraction that is automatically specified when you<br />
index of refraction select a tissue property.<br />
Source Spectrum Drop-down list of bioluminescent sources.<br />
Plot<br />
Tissue Properties Click to display graphs (cm -1 vs nm) of the absorption coefficient<br />
(μ a ), effective attenuation coefficient (μ eff ), and reduced scattering<br />
coefficient (μ’ s ).<br />
Source Spectrum Click to display the spectrum of the selected bioluminescent source<br />
(intensity versus wavelength, normalized to one).<br />
Results Tab<br />
Spectral Results<br />
ROI Name of the analyzed ROI.<br />
Depth (mm) Estimated depth of the point source.<br />
Total Flux (phot/s) Estimated total photon flux from the point source.<br />
Plot Linear Fit Displays a graph of normalized intensity versus the effective<br />
attenuation coefficient (μeff , the optical property of the tissue<br />
selected in the Tissue Properties drop-down list) along with the<br />
linear fit to these data determined by the spectral analysis code.<br />
Plot Intensity Displays a graph of normalized intensity versus wavelength.<br />
Intensity is normalized by the selected source spectrum and filter<br />
transmission properties.<br />
Export Opens a dialog box that enables you to save the results to a text file<br />
(.txt).<br />
Save Results<br />
Name A drop-down list of saved results. Includes the default name for<br />
new unsaved analysis results (SpIm_xx).<br />
Delete Deletes the selected results.<br />
Load Opens the selected results.<br />
Save Saves the analysis results (results name appears in the Name dropdown<br />
list).