Living Image 3.1
Living Image 3.1
Living Image 3.1

Create successful ePaper yourself
Turn your PDF publications into a flip-book with our unique Google optimized e-Paper software.
<strong>Living</strong> <strong>Image</strong> ® Software User’s Manual<br />
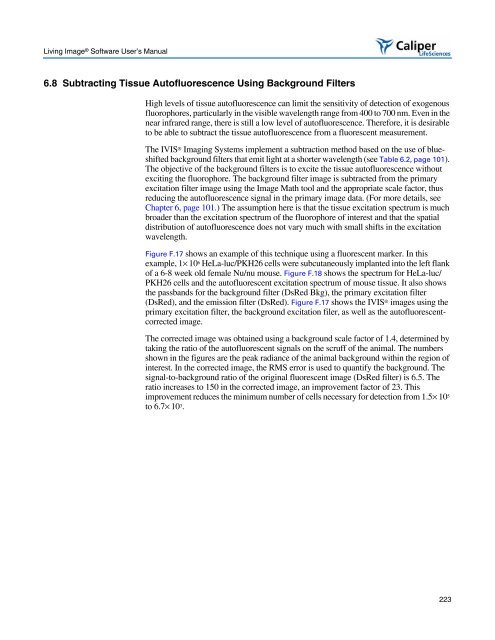
6.8 Subtracting Tissue Autofluorescence Using Background Filters<br />
High levels of tissue autofluorescence can limit the sensitivity of detection of exogenous<br />
fluorophores, particularly in the visible wavelength range from 400 to 700 nm. Even in the<br />
near infrared range, there is still a low level of autofluorescence. Therefore, it is desirable<br />
to be able to subtract the tissue autofluorescence from a fluorescent measurement.<br />
The IVIS ® Imaging Systems implement a subtraction method based on the use of blueshifted<br />
background filters that emit light at a shorter wavelength (see Table 6.2, page 101).<br />
The objective of the background filters is to excite the tissue autofluorescence without<br />
exciting the fluorophore. The background filter image is subtracted from the primary<br />
excitation filter image using the <strong>Image</strong> Math tool and the appropriate scale factor, thus<br />
reducing the autofluorescence signal in the primary image data. (For more details, see<br />
Chapter 6, page 101.) The assumption here is that the tissue excitation spectrum is much<br />
broader than the excitation spectrum of the fluorophore of interest and that the spatial<br />
distribution of autofluorescence does not vary much with small shifts in the excitation<br />
wavelength.<br />
Figure F.17 shows an example of this technique using a fluorescent marker. In this<br />
example, 1× 10 6 HeLa-luc/PKH26 cells were subcutaneously implanted into the left flank<br />
of a 6-8 week old female Nu/nu mouse. Figure F.18 shows the spectrum for HeLa-luc/<br />
PKH26 cells and the autofluorescent excitation spectrum of mouse tissue. It also shows<br />
the passbands for the background filter (DsRed Bkg), the primary excitation filter<br />
(DsRed), and the emission filter (DsRed). Figure F.17 shows the IVIS ® images using the<br />
primary excitation filter, the background excitation filer, as well as the autofluorescentcorrected<br />
image.<br />
The corrected image was obtained using a background scale factor of 1.4, determined by<br />
taking the ratio of the autofluorescent signals on the scruff of the animal. The numbers<br />
shown in the figures are the peak radiance of the animal background within the region of<br />
interest. In the corrected image, the RMS error is used to quantify the background. The<br />
signal-to-background ratio of the original fluorescent image (DsRed filter) is 6.5. The<br />
ratio increases to 150 in the corrected image, an improvement factor of 23. This<br />
improvement reduces the minimum number of cells necessary for detection from 1.5× 10 5<br />
to 6.7× 10 3.<br />
223