Rapport <strong>de</strong>s administrateurs suitepour l’année terminée le 31décembre 2007Les actionnaires sont avisés qu'une résolution ordinaire (résolution ordinaire numéro 5) a été adoptée lors <strong>de</strong>l'assemblée générale annuelle <strong>du</strong> 13 juin 2007, selon laquelle le conseil d'administration <strong>et</strong> les administrateurs<strong>du</strong> Fonds <strong>de</strong> fidélité <strong>du</strong> groupe <strong>MTN</strong> ont le droit d'accélérer les pério<strong>de</strong>s d'attente dans <strong>de</strong>s circonstancesexceptionnelles, à condition que les changements ne perm<strong>et</strong>tent à aucun participant d'exercer 100 % <strong>de</strong>sdroits d'appréciation qui lui sont accordés avant l'expiration <strong>de</strong> trois ans à partir <strong>de</strong> la date <strong>de</strong> l'attribution.Dans ce contexte, les actionnaires peuvent se référer au tableau ci-<strong>de</strong>ssous afin <strong>de</strong> noter les dates d'attente enrelation aux droits <strong>de</strong> plus-value d'action <strong>du</strong> Prési<strong>de</strong>nt-Directeur général <strong>du</strong> groupe attribués le 21 novembre2006 <strong>et</strong> le 2 avril 2007 <strong>et</strong> qui ont été accélérés pour aligner les dates d'attente à son contrat <strong>de</strong> service.Les avantages sur capitaux propres <strong>de</strong>s directeurs exécutifs <strong>et</strong> <strong>de</strong>s directeurs <strong>de</strong>s principales filialesPlans d'option d’achat d'actions <strong>et</strong> <strong>de</strong> droits <strong>de</strong> plus-value d'action pour l'année terminée le 31 décembre 2007.Bilanau1er janvier2007Attribuéspendantl'annéeExercéspendantl'annéeBilanau31 décembre2007Nom <strong>de</strong> l'adjoint<strong>du</strong> directeurPrix <strong>de</strong>l'offreDate <strong>de</strong>l'allocationoptionsréalisablesPrix <strong>de</strong>l'offreDate <strong>de</strong>l'exercice<strong>Group</strong>e <strong>MTN</strong>RS DabengwaOptions d'achat d’action 198 420 9,31 rands 02/09/2002 198 420 — 58 220 27,00 rands 01/12/2005291 100 27,00 rands 01/12/2003 291 100 58 220 27,00 rands 01/12/2006Droits <strong>de</strong> plus-valued'action 134 800 56,83 rands 31/05/2006 134 800 26 960 56,83 rands 30/11/200743 400 71,00 rands 21/11/2006 43 400 87 330 27,00 rands 01/12/20078 680 71,00 rands 21/11/2008667 720 469 300 26 960 56,83 rands 30/11/200887 330 27,00 rands 01/12/20088 680 71,00 rands 21/11/200940 440 56,83 rands 30/1 1/200913 020 71,00 rands 21/11/201040 440 56,83 rands 30/11/201013 020 71,00 rands 21/11/2011PF NhlekoOptions d'achat d’action 1 993 700 9,31 rands 02/09/2002 1 993 700 82 740 9,31 rands 02/09/2004Droits <strong>de</strong> plus-valued'action 516 400 71,00 rands 21/11/2006 516 400 477 740 9,31 rands 02/09/200523 700 98,50 rands 02/04/2007 23 700 716 610 9,31 rands 02/09/20062 510 100 2 533 800 716 610 9,31 rands 02/09/2007172 133 71,00 rands 21/11/20087 900 98,50 rands 02/04/2008172 133 71,00 rands 21/11/20097 900 98,50 rands 02/04/2009172 134 71,00 rands 21/11/20107 900 98,50 rands 02/04/2010RD Nisb<strong>et</strong>Options d'achat d’action 561 480 9,31 rands 02/09/2002 561 480 280 740 9,31 rands 02/09/200651 600 27,00 rands 01/12/2003 51 600 12 900 27,00 rands 01/12/2006Droits <strong>de</strong> plus-valued'action 197 400 71,00 rands 21/11/2006 197 400 280 740 9,31 rands 02/09/200719 350 27,00 rands 01/12/2007810 480 810 480 19 350 27,00 rands 01/12/200839 480 71,00 rands 21/11/200839 480 71,00 rands 21/11/200959 220 71,00 rands 21/11/201059 220 71,00 rands 21/11/2011140Rapport annuel intégré <strong>du</strong> groupe <strong>MTN</strong> n 31 décembre 2007
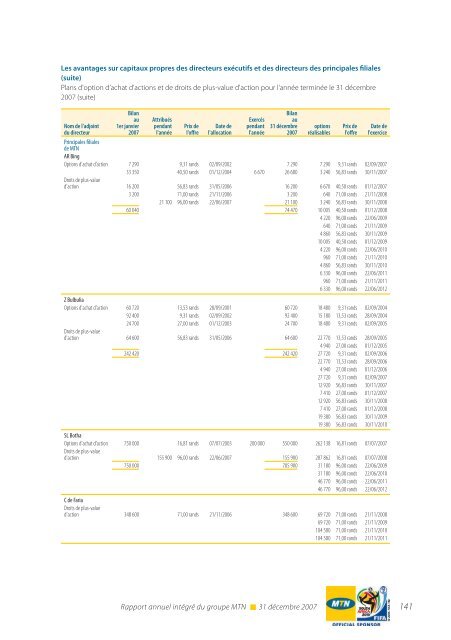
Les avantages sur capitaux propres <strong>de</strong>s directeurs exécutifs <strong>et</strong> <strong>de</strong>s directeurs <strong>de</strong>s principales filiales(suite)Plans d'option d’achat d'actions <strong>et</strong> <strong>de</strong> droits <strong>de</strong> plus-value d'action pour l'année terminée le 31 décembre2007 (suite)Nom <strong>de</strong> l'adjoint<strong>du</strong> directeurBilanau1er janvier2007Attribuéspendantl'annéePrix <strong>de</strong>l'offreDate <strong>de</strong>l'allocationExercéspendantl'annéeBilanau31 décembre2007optionsréalisablesPrix <strong>de</strong>l'offreDate <strong>de</strong>l'exercicePrincipales filiales<strong>de</strong> <strong>MTN</strong>AR BingOptions d'achat d’action 7 290 9,31 rands 02/09/2002 7 290 7 290 9,31 rands 02/09/200733 350 40,50 rands 01/12/2004 6 670 26 680 3 240 56,83 rands 30/11/2007Droits <strong>de</strong> plus-valued'action 16 200 56,83 rands 31/05/2006 16 200 6 670 40,50 rands 01/12/20073 200 71,00 rands 21/11/2006 3 200 640 71,00 rands 21/11/200821 100 96,00 rands 22/06/2007 21 100 3 240 56,83 rands 30/11/200860 040 74 470 10 005 40,50 rands 01/12/20084 220 96,00 rands 22/06/2009640 71,00 rands 21/11/20094 860 56,83 rands 30/11/200910 005 40,50 rands 01/12/20094 220 96,00 rands 22/06/2010960 71,00 rands 21/11/20104 860 56,83 rands 30/11/20106 330 96,00 rands 22/06/2011960 71,00 rands 21/11/20116 330 96,00 rands 22/06/2012Z BulbuliaOptions d'achat d’action 60 720 13,53 rands 28/09/2001 60 720 18 480 9,31 rands 02/09/200492 400 9,31 rands 02/09/2002 92 400 15 180 13,53 rands 28/09/200424 700 27,00 rands 01/12/2003 24 700 18 480 9,31 rands 02/09/2005Droits <strong>de</strong> plus-valued'action 64 600 56,83 rands 31/05/2006 64 600 22 770 13,53 rands 28/09/20054 940 27,00 rands 01/12/2005242 420 242 420 27 720 9,31 rands 02/09/200622 770 13,53 rands 28/09/20064 940 27,00 rands 01/12/200627 720 9,31 rands 02/09/200712 920 56,83 rands 30/11/20077 410 27,00 rands 01/12/200712 920 56,83 rands 30/11/20087 410 27,00 rands 01/12/200819 380 56,83 rands 30/11/200919 380 56,83 rands 30/11/2010SL BothaOptions d'achat d’action 750 000 16,81 rands 07/07/2003 200 000 550 000 262 138 16,81 rands 07/07/2007Droits <strong>de</strong> plus-valued'action 155 900 96,00 rands 22/06/2007 155 900 287 862 16,81 rands 07/07/2008750 000 705 900 31 180 96,00 rands 22/06/200931 180 96,00 rands 22/06/201046 770 96,00 rands 22/06/201146 770 96,00 rands 22/06/2012C <strong>de</strong> FariaDroits <strong>de</strong> plus-valued'action 348 600 71,00 rands 21/11/2006 348 600 69 720 71,00 rands 21/11/200869 720 71,00 rands 21/11/2009104 580 71,00 rands 21/11/2010104 580 71,00 rands 21/11/2011Rapport annuel intégré <strong>du</strong> groupe <strong>MTN</strong> n 31 décembre 2007 141