Région Afrique du Sud et Afrique de l'Est - MTN Group
Région Afrique du Sud et Afrique de l'Est - MTN Group
Région Afrique du Sud et Afrique de l'Est - MTN Group

Create successful ePaper yourself
Turn your PDF publications into a flip-book with our unique Google optimized e-Paper software.
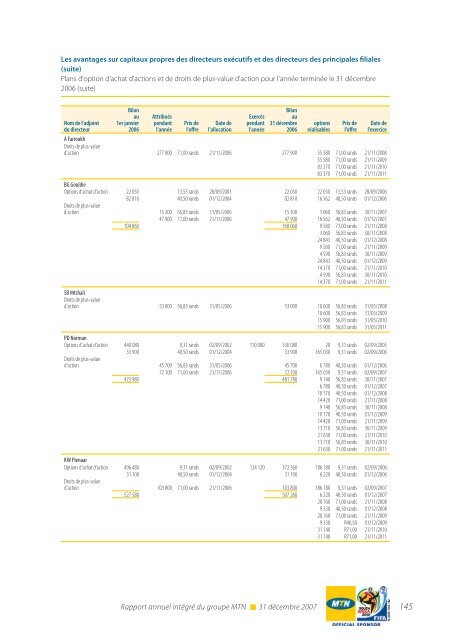
Les avantages sur capitaux propres <strong>de</strong>s directeurs exécutifs <strong>et</strong> <strong>de</strong>s directeurs <strong>de</strong>s principales filiales(suite)Plans d'option d’achat d'actions <strong>et</strong> <strong>de</strong> droits <strong>de</strong> plus-value d'action pour l'année terminée le 31 décembre2006 (suite)Nom <strong>de</strong> l'adjoint<strong>du</strong> directeurBilanau1er janvier2006Attribuéspendantl'annéePrix <strong>de</strong>l'offreDate <strong>de</strong>l'allocationExercéspendantl'annéeBilanau31 décembre2006optionsréalisablesPrix <strong>de</strong>l'offreDate <strong>de</strong>l'exerciceA FarroukhDroits <strong>de</strong> plus-valued'action 277 900 71,00 rands 21/11/2006 277 900 55 580 71,00 rands 21/11/200855 580 71,00 rands 21/11/200983 370 71,00 rands 21/11/201083 370 71,00 rands 21/11/2011BG GouldieOptions d'achat d’action 22 050 13,53 rands 28/09/2001 22 050 22 050 13,53 rands 28/09/200682 810 40,50 rands 01/12/2004 82 810 16 562 40,50 rands 01/12/2006Droits <strong>de</strong> plus-valued'action 15 300 56,83 rands 31/05/2006 15 300 3 060 56,83 rands 30/11/200747 900 71,00 rands 21/11/2006 47 900 16 562 40,50 rands 01/12/2007104 860 168 060 9 580 71,00 rands 21/11/20083 060 56,83 rands 30/11/200824 843 40,50 rands 01/12/20089 580 71,00 rands 21/11/20094 590 56,83 rands 30/11/200924 843 40,50 rands 01/12/200914 370 71,00 rands 21/11/20104 590 56,83 rands 30/11/201014 370 71,00 rands 21/11/2011SB MtshaliDroits <strong>de</strong> plus-valued'action 53 000 56,83 rands 31/05/2006 53 000 10 600 56,83 rands 31/05/200810 600 56,83 rands 31/05/200915 900 56,83 rands 31/05/201015 900 56,83 rands 31/05/2011PD NormanOptions d'achat d’action 440 080 9,31 rands 02/09/2002 110 000 330 080 20 9,31 rands 02/09/200533 900 40,50 rands 01/12/2004 33 900 165 030 9,31 rands 02/09/2006Droits <strong>de</strong> plus-valued'action 45 700 56,83 rands 31/05/2006 45 700 6 780 40,50 rands 01/12/200672 100 71,00 rands 21/11/2006 72 100 165 030 9,31 rands 02/09/2007473 980 481 780 9 140 56,83 rands 30/11/20076 780 40,50 rands 01/12/200710 170 40,50 rands 01/12/200814 420 71,00 rands 21/11/20089 140 56,83 rands 30/11/200810 170 40,50 rands 01/12/200914 420 71,00 rands 21/11/200913 710 56,83 rands 30/11/200921 630 71,00 rands 21/11/201013 710 56,83 rands 30/11/201021 630 71.00 rands 21/11/2011KW PienaarOptions d'achat d’action 496 480 9,31 rands 02/09/2002 124 120 372 360 186 180 9,31 rands 02/09/200631 100 40,50 rands 01/12/2004 31 100 6 220 40,50 rands 01/12/2006Droits <strong>de</strong> plus-valued'action 103 800 71,00 rands 21/11/2006 103 800 186 180 9,31 rands 02/09/2007527 580 507 260 6 220 40,50 rands 01/12/200720 760 71,00 rands 21/11/20089 330 40,50 rands 01/12/200820 760 71,00 rands 21/11/20099 330 R40,50 01/12/200931 140 R71,00 21/11/201031 140 R71,00 21/11/2011Rapport annuel intégré <strong>du</strong> groupe <strong>MTN</strong> n 31 décembre 2007 145