- Page 1 and 2:
Rapporto Rifiuti Speciali RAPPORTI
- Page 3 and 4:
Informazioni legali L’istituto Su
- Page 5 and 6:
APPENDICE 4 - LA GESTIONE DEI VEICO
- Page 7:
INDICE APPENDICE 3 DETTAGLIO ELABOR
- Page 10 and 11:
Tuttavia, per un’analisi più app
- Page 12 and 13:
Figura 1.2 - Relazione tra PIL e pr
- Page 14 and 15:
segue Tabella 1.3 - Produzione di r
- Page 16 and 17:
Figura 1.6 - Ripartizione percentua
- Page 18 and 19:
il quantitativo afferente ai veicol
- Page 20 and 21:
tonnellate). Ciò è dovuto alla ri
- Page 22 and 23:
1.3 LA PRODUZIONE DEI RIFIUTI SPECI
- Page 24 and 25:
Tabella 1.6 - Produzione dei rifiut
- Page 26 and 27:
Nel complesso l’attività manifat
- Page 28 and 29:
50%. Come segnalato all’interno d
- Page 30 and 31:
levare come i quantitativi rientran
- Page 32 and 33:
Figura 1.22 - Ripartizione percentu
- Page 34 and 35:
Figura 1.24 - Ripartizione percentu
- Page 36 and 37:
ticolare, i rifiuti gestiti nel 200
- Page 38 and 39:
Tabella 2.1 - Quadro riepilogativo
- Page 40 and 41:
Figura 2.6 Gestione dei rifiuti spe
- Page 42 and 43:
iologico, essendo i due trattamenti
- Page 44 and 45:
Tabella 2.3 - Smaltimento rifiuti s
- Page 46 and 47:
Tabella 2.5 - Smaltimento rifiuti s
- Page 48 and 49:
Nelle tabelle 2.6-2.10, sono indica
- Page 50 and 51:
Tabella 2.7 - Smaltimento rifiuti s
- Page 52 and 53:
Tabella 2.9 - Smaltimento rifiuti s
- Page 54 and 55:
2.2 LA GESTIONE DEI RIFIUTI URBANI
- Page 56 and 57:
segue Tabella 2.10 - Recupero dei r
- Page 58 and 59:
segue Tabella 2.11 - Recupero di en
- Page 60 and 61:
Tabella 2.12 - Smaltimento dei rifi
- Page 62 and 63:
segue Tabella 2.12 - Smaltimento de
- Page 64 and 65:
questo paragrafo è rappresentato d
- Page 66 and 67:
Tabella 2.14 - Incenerimento e coin
- Page 68 and 69:
segue Tabella 2.14 - Incenerimento
- Page 70 and 71:
Tabella 2.15 - Incenerimento e coin
- Page 72 and 73:
segue Tabella 2.15 - Incenerimento
- Page 74 and 75:
Figura 2.20 - Incenerimento e coinc
- Page 76 and 77:
Per quanto attiene alle tipologie d
- Page 78 and 79:
Tabella 2.17 - Incenerimento e coin
- Page 80 and 81:
Tabella 2.19 - Incenerimento e coin
- Page 82 and 83:
che, laterizi e altri materiali per
- Page 84 and 85:
Figura 2.24 - Numero impianti di di
- Page 86 and 87:
La Sardegna è la regione che smalt
- Page 88 and 89:
Figura 2.29 - Principali tipologie
- Page 90 and 91:
Tabella 2.21 - Numero di discariche
- Page 92 and 93:
Tabella 2.23 - Rifiuti speciali sma
- Page 94 and 95:
Tabella 2.25 - Rifiuti speciali sma
- Page 96 and 97:
segue Tabella 2.25 - Rifiuti specia
- Page 98 and 99:
Tabella 2.26 - Rifiuti speciali sma
- Page 100 and 101:
segue Tabella 2.26 - Rifiuti specia
- Page 102 and 103:
GESTIONE RIFIUTI SPECIALI 101
- Page 104 and 105:
segue Impianti di incenerimento e c
- Page 106 and 107:
segue Impianti di incenerimento e c
- Page 108 and 109:
segue Impianti di incenerimento e c
- Page 110 and 111:
segue Impianti di incenerimento e c
- Page 112 and 113:
segue Impianti di incenerimento e c
- Page 114 and 115:
segue Impianti di incenerimento e c
- Page 116 and 117:
segue Impianti di incenerimento e c
- Page 118 and 119:
segue Impianti di incenerimento e c
- Page 120 and 121:
segue Impianti di incenerimento e c
- Page 122 and 123:
segue Impianti di incenerimento e c
- Page 124 and 125:
segue Impianti di incenerimento e c
- Page 126 and 127:
segue Impianti di incenerimento e c
- Page 128 and 129:
segue Impianti di incenerimento e c
- Page 130 and 131:
segue Impianti di incenerimento e c
- Page 132 and 133:
segue Impianti di incenerimento e c
- Page 134 and 135:
segue Impianti di incenerimento e c
- Page 136 and 137:
segue Impianti di incenerimento e c
- Page 138 and 139:
segue Impianti di incenerimento e c
- Page 140 and 141:
segue Impianti di incenerimento e c
- Page 142 and 143:
segue Impianti di incenerimento e c
- Page 144 and 145:
segue Impianti di incenerimento e c
- Page 146 and 147:
segue Impianti di incenerimento e c
- Page 148 and 149:
Tabella 1 - Quantità di rifiuti sp
- Page 150 and 151:
Tabella 2 - Quantità di rifiuti sp
- Page 152 and 153:
Tabella 3 - Quantità di rifiuti sp
- Page 154 and 155:
Tabella 4 - Quantità di rifiuti sp
- Page 156 and 157:
Tabella 5 - Quantità di rifiuti sp
- Page 158 and 159:
Tabella 6 - Quantità di rifiuti sp
- Page 160 and 161:
Tabella 7 - Quantità di rifiuti sp
- Page 162 and 163:
Tabella 8 - Quantità di rifiuti sp
- Page 164 and 165:
Tabella 9 - Quantità di rifiuti sp
- Page 166 and 167:
Tabella 10 - Quantità di rifiuti s
- Page 168 and 169:
Tabella 11 - Quantità di rifiuti s
- Page 170 and 171:
Tabella 13 - Quantità di rifiuti s
- Page 172 and 173:
Tabella 15 - Quantità di rifiuti s
- Page 174 and 175:
Tabella 17 - Quantità di rifiuti s
- Page 176 and 177:
Tabella 19 - Quantità di rifiuti s
- Page 178 and 179:
Tabella 21 - Quantità di rifiuti s
- Page 180 and 181:
Tabella 23 - Quantità di rifiuti s
- Page 182 and 183:
Tabella 25 - Quantità di rifiuti s
- Page 184 and 185:
Tabella 27 - Quantità di rifiuti s
- Page 186 and 187:
Tabella 31 - Quantità di rifiuti s
- Page 188 and 189:
Tabella 33 - Quantità di rifiuti s
- Page 190 and 191:
Tabella 35 - Quantità di rifiuti s
- Page 192 and 193:
Tabella 37 - Quantità di rifiuti s
- Page 194 and 195:
Tabella 39 - Quantità di rifiuti s
- Page 196 and 197:
Tabella 40 - Quantità di rifiuti s
- Page 198 and 199:
APPENDICE 2 - DETTAGLIO REGIONALE D
- Page 200 and 201:
il 62,0%. Tali rifiuti, pari a oltr
- Page 202 and 203:
Figura 1.5 - Ripartizione della ges
- Page 204 and 205:
Figura 2.2 - Operazioni di recupero
- Page 206 and 207:
3. LOMBARDIA, ANNI 2007 - 2008 La g
- Page 208 and 209:
Di seguito, si analizzano i dati re
- Page 210 and 211:
4. TRENTINO ALTO ADIGE, ANNI 2007 -
- Page 212 and 213:
Figura 4.4 - Ripartizione della ges
- Page 214 and 215:
Figura 5.2 - Operazioni di recupero
- Page 216 and 217:
Figura 5.5 - Ripartizione della ges
- Page 218 and 219:
Figura 6.2 - Operazioni di recupero
- Page 220 and 221:
Figura 6.5 - Ripartizione della ges
- Page 222 and 223:
Figura 7.2 - Operazioni di recupero
- Page 224 and 225:
titativi sono stati smaltiti presso
- Page 226 and 227:
teriali edili) e in attività di ri
- Page 228 and 229:
Figura 8.5 - Ripartizione della ges
- Page 230 and 231:
Figura 9.2 - Operazioni di recupero
- Page 232 and 233: 10. UMBRIA, ANNI 2007 - 2008 La ges
- Page 234 and 235: Figura 10.4 - Ripartizione della ge
- Page 236 and 237: Figura 11.2 - Operazioni di recuper
- Page 238 and 239: Figura 11.5 - Ripartizione della ge
- Page 240 and 241: Figura 12.2 - Operazioni di recuper
- Page 242 and 243: Figura 12.5 - Ripartizione della ge
- Page 244 and 245: Figura 13.2 - Operazioni di recuper
- Page 246 and 247: 14. MOLISE, ANNI 2007 - 2008 La ges
- Page 248 and 249: l’anno precedente (circa 31 mila
- Page 250 and 251: 15. CAMPANIA, ANNI 2007 - 2008 La g
- Page 252 and 253: tre, i quantitativi dei veicoli fuo
- Page 254 and 255: 16. PUGLIA, ANNI 2007 - 2008 La ges
- Page 256 and 257: Figura 16.4 - Ripartizione della ge
- Page 258 and 259: Figura 17.2 - Operazioni di recuper
- Page 260 and 261: Figura 17.5 - Ripartizione della ge
- Page 262 and 263: Figura 18.2 - Operazioni di recuper
- Page 264 and 265: Figura 18.5 - Ripartizione della ge
- Page 266 and 267: Figura 19.2 - Operazioni di recuper
- Page 268 and 269: late nell’anno 2008, rappresentan
- Page 270 and 271: Figura 20.2 - Operazioni di recuper
- Page 272 and 273: Figura 20.5 - Ripartizione della ge
- Page 274 and 275: Tabella 1.3 - Gestione di rifiuti s
- Page 276 and 277: Tabella 1.4 - Gestione dei rifiuti
- Page 278 and 279: Tabella 1.5 - Altre attività di ge
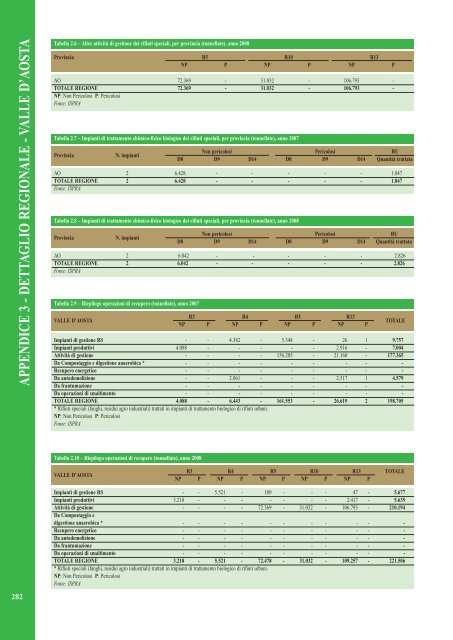
- Page 280 and 281: Tabella 1.9 - Riepilogo operazioni
- Page 284 and 285: Tabella 2.11 - Riepilogo operazioni
- Page 286 and 287: Tabella 3.3 - Gestione dei rifiuti
- Page 288 and 289: Tabella 3.4 - Gestione dei rifiuti
- Page 290 and 291: Tabella 3.5 Altre attività di gest
- Page 292 and 293: Tabella 3.9 - Riepilogo operazioni
- Page 294 and 295: 3.4 TRENTINO ALTO ADIGE, ANNI 2007
- Page 296 and 297: Tabella 4.9-Operazioni di recupero
- Page 298 and 299: Tabella 5.3 - Gestione dei rifiuti
- Page 300 and 301: Tabella 5.4 - Gestione dei rifiuti
- Page 302 and 303: Tabella 5.5 - Altre attività di ge
- Page 304 and 305: Tabella 5.9 - Riepilogo operazioni
- Page 306 and 307: 3.6 FRIULI VENEZIA GIULIA, ANNI 200
- Page 308 and 309: Tabella 6.4 - Gestione dei rifiuti
- Page 310 and 311: Tabella 6.9 - Riepilogo operazioni
- Page 312 and 313: 3.7 LIGURIA, ANNI 2007 - 2008 Tabel
- Page 314 and 315: Tabella 7.5 - Altre attività di ge
- Page 316 and 317: Tabella 7.9 - Riepilogo operazioni
- Page 318 and 319: 3.8 EMILIA ROMAGNA, ANNI 2007 - 200
- Page 320 and 321: segue Tabella 8.3 - Gestione dei ri
- Page 322 and 323: segue Tabella 8.4 - Gestione dei ri
- Page 324 and 325: Tabella 8.7 - Impianti di trattamen
- Page 326 and 327: Tabella 8.11 - Riepilogo operazioni
- Page 328 and 329: Tabella 9.3 - Gestione rifiuti spec
- Page 330 and 331: Tabella 9.5 -Altre attività di ges
- Page 332 and 333:
Tabella 9.9 - Riepilogo operazioni
- Page 334 and 335:
3.10 UMBRIA, ANNI 2007 - 2008 Tabel
- Page 336 and 337:
Tabella 10.9 - Riepilogo operazioni
- Page 338 and 339:
Tabella 11.3 - Gestione dei rifiuti
- Page 340 and 341:
Tabella 11.6 - Altre attività di g
- Page 342 and 343:
3.12 LAZIO, ANNI 2007 - 2008 Tabell
- Page 344 and 345:
Tabella 12.4 - Gestione dei rifiuti
- Page 346 and 347:
Tabella 12.7 - Impianti di trattame
- Page 348 and 349:
Tabella 12.11 - Riepilogo operazion
- Page 350 and 351:
Tabella 13.3 - Gestione dei rifiuti
- Page 352 and 353:
Tabella 13.5 -Altre attività di ge
- Page 354 and 355:
Tabella 13.11 - Riepilogo operazion
- Page 356 and 357:
Tabella 14.4 - Gestione dei rifiuti
- Page 358 and 359:
Tabella 14.11 - Riepilogo operazion
- Page 360 and 361:
Tabella 15.3 - Gestione dei rifiuti
- Page 362 and 363:
Tabella 15.5 - Altre attività di g
- Page 364 and 365:
Tabella 15.9 - Riepilogo operazioni
- Page 366 and 367:
3.16 PUGLIA, ANNI 2007 - 2008 Tabel
- Page 368 and 369:
Tabella 16.4 - Gestione dei rifiuti
- Page 370 and 371:
Tabella 16.7 - Impianti di trattame
- Page 372 and 373:
Tabella 16.11 - Riepilogo operazion
- Page 374 and 375:
Tabella 17.4 - Gestione dei rifiuti
- Page 376 and 377:
3.18 CALABRIA, ANNI 2007 - 2008 Tab
- Page 378 and 379:
Tabella 18.5 - Altre attività di g
- Page 380 and 381:
3.19 SICILIA, ANNI 2007 - 2008 Tabe
- Page 382 and 383:
Tabella 19.4 - Gestione dei rifiuti
- Page 384 and 385:
Tabella 19.7 - Impianti di trattame
- Page 386 and 387:
3.20 SARDEGNA, ANNI 2007 - 2008 Tab
- Page 388 and 389:
segue Tabella 20.3 - Gestione dei r
- Page 390 and 391:
Tabella 20.5 - Altre attività che
- Page 392 and 393:
Tabella 20.11 - Riepilogo operazion
- Page 394 and 395:
Tabella 1 - Parco circolante in Ita
- Page 396 and 397:
4.3 PRODUZIONE DI RIFIUTI DA AUTODE
- Page 398 and 399:
segue Tabella 6 - Numero di demolit
- Page 400 and 401:
Figura 4 - Quantità di rottami der
- Page 402 and 403:
APPENDICE 4 - LA GESTIONE DEI VEICO
- Page 404 and 405:
n) i tipi, le quantità e l’origi
- Page 406 and 407:
In merito, appare opportuno evidenz
- Page 408 and 409:
PIEMONTE D.C.R. n. 436-11546 del 30
- Page 410 and 411:
TRENTINO ALTO ADIGE I piani di gest
- Page 412 and 413:
L.R. n. 25 del 18/05/1998 e s.m.i.
- Page 414 and 415:
D.C.R. n. 112 del 10/07/2002 B.U.R.
- Page 416 and 417:
PUGLIA Decreto n. 41 del 06/03/2001
- Page 418 and 419:
Tabella 1 - Piemonte Provincia Pian
- Page 420 and 421:
Tabella 4 - Trentino Alto Adige Pro
- Page 422 and 423:
Tabella 6 - Friuli Venezia Giulia P
- Page 424 and 425:
Tabella 8 - Emilia Romagna Provinci
- Page 426 and 427:
segue Tabella 9 - Toscana Provincia
- Page 428 and 429:
Tabella 15 - Campania Provincia Nap
- Page 430 and 431:
Tabella 20 - Sardegna Provincia Cag
- Page 432 and 433:
Tabella 6.2 - Confronto dei dati de
- Page 434 and 435:
Figura 6.1 - Produzione di rifiuti
- Page 436 and 437:
Tabella 6.6 -Tipologie di trattamen
- Page 438 and 439:
Figura 7.1 - Quantità di rifiuti e
- Page 440 and 441:
Tabella 7.2 - Quantità di rifiuti
- Page 442 and 443:
Figura 7.6 - Rifiuti pericolosi esp
- Page 444 and 445:
Figura 7.8 - Quantità di rifiuti i
- Page 446 and 447:
Figura 7.11 - Quantità di rifiuti
- Page 448 and 449:
Figura 7.14 - Importazione di rifiu
- Page 450 and 451:
La quantità totale di RAEE (domest
- Page 452 and 453:
Figura 3 - Quantitativi RAEE domest
- Page 454 and 455:
Tabella 2 - Quantitativi RAEE domes
- Page 456 and 457:
Figura 6 - Ripartizione RAEE domest
- Page 458 and 459:
Figura 9 - Quantitativi RAEE profes
- Page 460 and 461:
Tabella 4 - Quantitativi RAEE profe
- Page 462 and 463:
Figura 11- Ripartizione RAEE profes
- Page 464 and 465:
Tabella 5 - Impianti dedicati al tr
- Page 466 and 467:
Tabella 8 - Quantitativi RAEE per C
- Page 468 and 469:
(Regolamento relativo alla determin
- Page 470 and 471:
Riguardo alla gestione, in consider
- Page 472 and 473:
Figura 9.2 Quantità di rifiuti in
- Page 474:
ISBN 978-88-448-0467-1 RAPPORTI 125