- Page 1 and 2:
ENVIRONMENTAL CONSEQUENCES OF TIMBE
- Page 3 and 4:
USDA Forest Service General Technic
- Page 5 and 6:
REW 'ORD One of the pressing proble
- Page 7 and 8:
BIOLOGICAL IMPLICATIONS Biological
- Page 9 and 10:
By the mid-1 960's the apparently u
- Page 11 and 12:
Scientist, audience: "The Three-Mil
- Page 13 and 14:
I believe that the future of forest
- Page 15 and 16:
enewable resource that can be proce
- Page 17 and 18:
productive capacity. Recent legisla
- Page 19 and 20:
Much of the research investigating
- Page 21 and 22:
Six sale area blocks were logged (f
- Page 23 and 24:
Understory Removal Figure 4.--Eccpe
- Page 25 and 26:
Gentle slopes and easy access to cu
- Page 27 and 28:
Each of the four cutting units was
- Page 29 and 30:
A concerted effort was made to coor
- Page 31 and 32:
oriented toward the basic response
- Page 33 and 34:
WOODY MATERIAL IN NORTHERN ROCKY MO
- Page 35 and 36:
STANDING, 3 " 1 DIA. ? (GREEN & DEA
- Page 37 and 38:
I 11 Table 1,--Volume of wood by co
- Page 39 and 40:
Small material under 3 inch (7.6 cm
- Page 41 and 42:
Depending on the cutting and treatm
- Page 43 and 44:
MICROENVIRONMENTAL RESPONSE TO HARV
- Page 45 and 46:
I Where: Cs is the concentration at
- Page 47 and 48:
Figure I.-- Residue treatments used
- Page 49 and 50:
HARVESTING AND RESIDUE INFLUENCES R
- Page 51 and 52:
I 1 1 1 1 1 1 1 1 1 1 1 JAN. FEB. M
- Page 53 and 54:
Sensible heat flux, evaporative flu
- Page 55 and 56:
SOLO, 1977- 78 UNCUT CUT Mean max.
- Page 57 and 58:
It is logical that if surface tempe
- Page 59 and 60:
0 - 5 - 10 - 15 20 - Chips - Clrare
- Page 61 and 62:
Brown, crumbly, decayed material (B
- Page 63 and 64:
At Coram, steep harvested slopes ha
- Page 65 and 66:
surface of unburned and hard-burned
- Page 67 and 68:
canopy. Light then indirectly cause
- Page 69 and 70:
Moisture Moisture is frequently ide
- Page 71 and 72:
Net radiation--the measure of the a
- Page 73 and 74:
Table 5.--Possible solutions for po
- Page 75 and 76:
Cochran, P. H. 1969. Thermal proper
- Page 77 and 78:
Lommen, P. W., Cr, R. Schwintzer, C
- Page 79 and 80:
Stark, Nel 1 ie. 1980. The impacts
- Page 81 and 82:
and water use during the growing se
- Page 83 and 84:
The main study site (fig. 1) occupi
- Page 85 and 86:
The four residues util i zation tre
- Page 87 and 88:
RAIN The major precipitation instru
- Page 89 and 90:
Figure 5.--SG,L. wuwr zc)as measure
- Page 91 and 92:
S treamf 1 ow A &foot H-flume was i
- Page 93 and 94:
Figure 7.--Snow water equivalent on
- Page 95 and 96:
Soi 1 Water Water present in the so
- Page 97 and 98:
SILVICULTURE TREATMENTS Si 1 vicul
- Page 99 and 100:
As indicated in figure 11 and appen
- Page 101 and 102:
The most consistent difference in w
- Page 103 and 104:
MEAN CONSUMPTIVE USE -ALL YEARS (19
- Page 105 and 106:
Lowest daily water use occurred at
- Page 107 and 108:
6. Water use began in Apri 1 , acce
- Page 109 and 110:
Klages, M. G., R. C. McConnell , an
- Page 111 and 112:
APPENDICES Appendix A.--Hydrograph
- Page 113 and 114:
Appendix C.--Rainfall reaching the
- Page 115 and 116:
Appendix E.--Water use during the g
- Page 117 and 118:
One of the most efficient methods o
- Page 119 and 120:
Control Chipped Picked up Broadcast
- Page 121 and 122:
Control Chapped Picked up Broadcast
- Page 123 and 124:
Control Chipped Picked up Broadcast
- Page 125 and 126:
' Control Chipped and Picked up and
- Page 127 and 128:
One of the least detrimental residu
- Page 129 and 130:
INTRODUCTION In the early days, the
- Page 131 and 132:
%pire 1.--Measured concentrations (
- Page 133 and 134:
The silvicul tural treatments appli
- Page 135 and 136:
I 2 Table 2. --Percent of total qua
- Page 137 and 138:
Unmerchantable TOP Shrubs Lower Cro
- Page 139 and 140:
create a nitrogen deficiency during
- Page 141 and 142:
Steele, R. W. 1975. Understory burn
- Page 143 and 144:
National Forest. This paper summari
- Page 145 and 146:
UNIT 2 CONVENT IONALLY Du Bois, Wyo
- Page 147 and 148:
Trees Figures 3 and 4 show the oven
- Page 149 and 150:
Weights of typical trees on these t
- Page 151 and 152:
pi1 ed-burned treatments were lowes
- Page 153 and 154:
MINERAL SOIL Total nutrient content
- Page 155 and 156:
Tab1 e 5. --Concentrations of avai
- Page 157 and 158:
Table 6. --Average concentrations o
- Page 159 and 160:
sites. Burning then transformed the
- Page 161 and 162:
RESIDUE DECAY PROCESSES AND ASSOCIA
- Page 163 and 164:
The hardwood or angiospermous timbe
- Page 165 and 166:
Woody Substrates Gyrnnospermsr (Int
- Page 167 and 168:
Natural inoculation of residues may
- Page 169 and 170:
On the Coram site, brown-rot fungi
- Page 171 and 172:
Table 2.--Probability (P) of encoun
- Page 173 and 174:
Recognizable brown-cubical decayed
- Page 175 and 176:
I Newly formed, small-dimension res
- Page 177 and 178:
Highley, T. L. 1976. Hemicellulases
- Page 179 and 180:
MICROBIAL PROCESSES ASSOCIATED WITH
- Page 181 and 182:
Nonsymbiotic N Fixation Free-1 ivin
- Page 183 and 184:
In a previous paper (Jurgensen and
- Page 185 and 186:
Symbiotic N Fixation The establishm
- Page 187 and 188:
carbon and NHq (Ahlgren, 1974). Mic
- Page 189 and 190:
Prescribed f~re CLEARCUT - BURN CLE
- Page 191 and 192:
Hungerford, R.9. 1980. Microenvi ro
- Page 193 and 194:
ECOLOGY OF ECTOMYCORRHIZAE IN NORTH
- Page 195 and 196:
Coram - Subalpine fir Site (ABLAICL
- Page 197 and 198:
Figure 2.-- ReZative yield capabiZi
- Page 199 and 200:
Figure 5. -- Percentage of soCZ-woo
- Page 201 and 202:
Figure 9,-- Percentage of toid ectm
- Page 203 and 204:
Effect of Soil Components on Ectomy
- Page 205 and 206:
Effect of Organic Matter Quantity o
- Page 207 and 208:
PARTIAL CUT Effect of Harvesting on
- Page 209 and 210:
Figure 20. -- Average nwnbers of ac
- Page 211 and 212:
Gijbl , F. 1967. Mykorrhizauntersuc
- Page 213 and 214: BIOLOGICAL IMPLICATIONS Initial cha
- Page 215 and 216: FOREST SOIL BIOLOGY The act of incr
- Page 217 and 218: the soil will retain its ability to
- Page 219 and 220: Since the best quantity of organic
- Page 221 and 222: We can also visualize situations on
- Page 223 and 224: Harvey, A. E., M. F. Jurgensen, and
- Page 225 and 226: INTRODUCTION Vegetation integrates
- Page 227 and 228: Because of cool, wet weather in 197
- Page 229 and 230: We determined volume and cover usin
- Page 231 and 232: The stems were divided at 4 mm (0.1
- Page 233 and 234: RESIDUES TREATMENT EFFECTS As descr
- Page 235 and 236: Overall shrub recovery rates do not
- Page 237 and 238: Rose behaved similar to ninebark (f
- Page 239 and 240: Meanwhile, small shrub cover change
- Page 241 and 242: Biomass Regression analyses relatin
- Page 243 and 244: SILVICULTURE TREATMENT EFFECTS Harv
- Page 245 and 246: RESIDUES TREATMENT EFFECTS Major sh
- Page 247 and 248: Lesser vegetation--herbs and small
- Page 249 and 250: Leaf and stem components of the shr
- Page 251 and 252: APPENDIX I Trees and shrubs found o
- Page 253 and 254: INTRODUCTION Many western larch (La
- Page 255 and 256: Figure 2. --Lower cutting blocks on
- Page 257 and 258: each permanent point) of the clearc
- Page 259 and 260: Figure 3.--Marking gemination and c
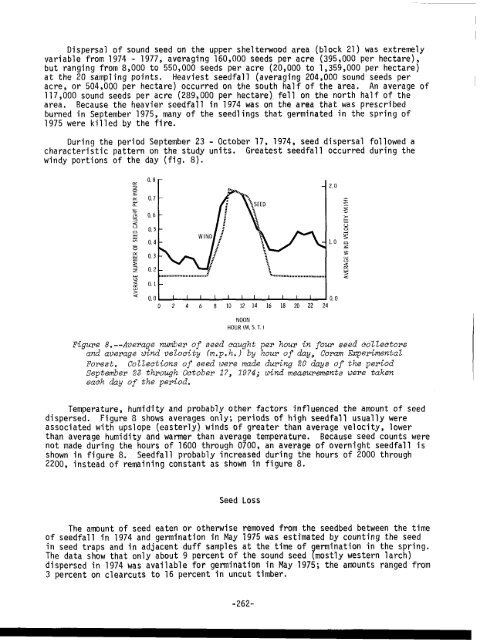
- Page 261 and 262: were not significant. These treatme
- Page 263: Tab1 e 2. --Fi 11 ed conifer seed (
- Page 267 and 268: Table $.--Number of 3- and 5-year-o
- Page 269 and 270: Table 6. --Germination of conifers
- Page 271 and 272: Survival, growth and form will be m
- Page 273 and 274: Es tab1 ishment and Initial Develop
- Page 275 and 276: to the amount of residue originally
- Page 277 and 278: As the following tabulation shows,
- Page 279 and 280: Soot-Seeded Broadcast burning, and
- Page 281 and 282: Natural Regeneration Natural regene
- Page 283 and 284: .4s shown in fig. 5, vegetation was
- Page 285 and 286: Interestingly, the high phenol leve
- Page 287 and 288: DeByle, Norbert V. 1980. Harvesting
- Page 289 and 290: EFFECT OF SILVICULTURAL PRACTICES,
- Page 291 and 292: mountain pine beetle. These two for
- Page 293 and 294: GROUP SELECTION 22 CONTROL SHELTERW
- Page 295 and 296: FIELD AND LABORATORY PROCEDURES To
- Page 297 and 298: I Many of the groups were trapped v
- Page 299 and 300: shelterwood with residues, were sig
- Page 301 and 302: HARVESTING AND RESIDUE MANAGEMENT T
- Page 303 and 304: HARVESTING AND RESIDUE MANAGEMENT T
- Page 305 and 306: HARVESTING AND RESIDUE MANAGEMENT T
- Page 307 and 308: indicate a treatment effect of burn
- Page 309 and 310: Undisturbed Forest .". . . . Clearc
- Page 311 and 312: 1 equally abundant in all treatment
- Page 313 and 314: I not seem to be directly caused by
- Page 315 and 316:
the undisturbed forests. Some resea
- Page 317 and 318:
Huhta, V., E. Karppinen, M. Nurmine
- Page 319 and 320:
POPULATIONS OF SOME FOREST LITTER,
- Page 321 and 322:
STUDY DESIGN The study area is loca
- Page 323 and 324:
GROUP SELECTION 22 CONTROL '... . .
- Page 325 and 326:
Sampling in 1977 was restricted to
- Page 327 and 328:
Table 1 .--Mean total mesofauna pop
- Page 329 and 330:
0 - (JUNE) from S helterwood (AUGUS
- Page 331 and 332:
SHELTERWOOD--RESIDUE BURNED The eff
- Page 333 and 334:
In the first season or two followin
- Page 335 and 336:
LITERATURE CITED Ahlgren, I. F. 197
- Page 337 and 338:
A REVIEW OF SOME INTERACTIONS BETWE
- Page 339 and 340:
and Keen 1960; Felix and others 197
- Page 341 and 342:
Pissodes strobi Peck, In a thinned
- Page 343 and 344:
foresters feel as though "It's 1 i
- Page 345 and 346:
The large aerial spray programs aga
- Page 347 and 348:
Weakened living trees, or trees kil
- Page 349 and 350:
Most western pine beetle attacks in
- Page 351 and 352:
The galleries, or mines, of wood bo
- Page 353 and 354:
Other wood borers. --Several specie
- Page 355 and 356:
Deterioration of spruce (Picea a. )
- Page 357 and 358:
The eruption of Mount Saint Helens
- Page 359 and 360:
Bark and engraver beetles infesting
- Page 361 and 362:
In the northern Rockies, one conife
- Page 363 and 364:
management, and not the beetle." If
- Page 365 and 366:
investigation regardin controlled b
- Page 367 and 368:
WOOD BORERS Mitchell and Martin (In
- Page 369 and 370:
Still, by 1938, there was a feeling
- Page 371 and 372:
I Different i nvesti gators have us
- Page 373 and 374:
if the forest floor is completely c
- Page 375 and 376:
Carabids as biological control agen
- Page 377 and 378:
een placed for protection from rode
- Page 379 and 380:
with every tree in the stand contin
- Page 381 and 382:
Spiders as predators.--Studies have
- Page 383 and 384:
At least two studies have been made
- Page 385 and 386:
In the long-leaf pine forests in th
- Page 387 and 388:
RESIDUES, FIRES, INSECTS, AND FORES
- Page 389 and 390:
In the spruce-fir stands infested w
- Page 391 and 392:
Recently, Senator John Me1 cher (Mo
- Page 393 and 394:
plans. Since fire, too, is a decomp
- Page 395 and 396:
CHANGING FOREST INSECT PROBLEMS Ins
- Page 397 and 398:
Basham, J. T. 1957. The deteriorati
- Page 399 and 400:
Cole, D. M. 1978. Feasibility of si
- Page 401 and 402:
Fellin, D. G. and P. C. Johnson. 19
- Page 403 and 404:
Graham, S. A. 1922. Some entomoloqi
- Page 405 and 406:
Huhta, V., M. Nurminen and A. Valpa
- Page 407 and 408:
Lawrence, W. H. and 3. H. Rediske.
- Page 409 and 410:
Miller, J. M. and J. E. Patterson.
- Page 411 and 412:
Rice, L * A. 1932. The effect of fi
- Page 413 and 414:
Stoddard, H. L. Sr. 1963. Bird habi
- Page 415 and 416:
Weaver, Harol d. 1951. Fire as an e
- Page 417 and 418:
RESOURCE MANAGEMENT IMPLICATIONS Th
- Page 419 and 420:
INFLUENCE OF HARVESTING AND RESIDUE
- Page 421 and 422:
F
- Page 423 and 424:
NEAR COMPLETE Figure 2.--Byrmnts f
- Page 425 and 426:
Figure 3.-- Bymrmrs fireZine intens
- Page 427 and 428:
F5qure 4. --Byramrs fireZ-Cne inten
- Page 429 and 430:
1. Nomographs of Rate of Spread, Fi
- Page 431 and 432:
3. Consider other fire-related fact
- Page 433 and 434:
Puckett, John V., Cameron M. Johnst
- Page 435 and 436:
Important and rapid progress has be
- Page 437 and 438:
tlarvested Areas What happened when
- Page 439 and 440:
UNCUT SHELTERWOOD Protect understor
- Page 441 and 442:
Initially the areas are rated low.
- Page 443 and 444:
The primary reason for this discrep
- Page 445 and 446:
f n contrast to displaced bears, so
- Page 447 and 448:
Quantitative data on grizzly behavi
- Page 449 and 450:
Asherin, Duane A. 1976. Changes in
- Page 451 and 452:
Leege, Thomas A. 1969. Burning sera
- Page 453 and 454:
Reynolds, Hudson G. 1969. Aspen gro
- Page 455 and 456:
INFLUENCES OF HARVESTING AND RESIDU
- Page 457 and 458:
CLEARCUT LOGGING & COMPLETE BURN DE
- Page 459 and 460:
C LEARCUT LOGGING & BROADCAST BURN
- Page 461 and 462:
EFFECTS OF SMALL MAMMALS ON FOREST
- Page 463 and 464:
I I Habitat Manipulation Small mamm
- Page 465 and 466:
Fala, Robert A. 1975. Effects of pr
- Page 467 and 468:
Tevis, Lloyd Jr. l956b. Pocket goph
- Page 469 and 470:
forests are cavity nesters. They ar
- Page 471 and 472:
GROUP SELECTION: A1 1 merchantab le
- Page 473 and 474:
TABLE 3. Pre- and post-logging volu
- Page 475 and 476:
Censuses Censuses for all species (
- Page 477 and 478:
Fbgure 6.-- Lightn
- Page 479 and 480:
Pileated Woodpeckers on the CEF nes
- Page 481 and 482:
TABLE 7. Percent of sampling time t
- Page 483 and 484:
I Observed woodpecker feeding Down,
- Page 485 and 486:
Table 9 shows feeding time in the l
- Page 487 and 488:
L c - 10- ul 2 0 8- 6 - 4 2 - - 0 .
- Page 489 and 490:
Figure 15. -- A Hairy Woodpecker ne
- Page 491 and 492:
~
- Page 493 and 494:
oth offered advice on study site se
- Page 495 and 496:
Hairy Woodpecker Downy Woodpecker B
- Page 497 and 498:
THE SITUATION Forest land managers
- Page 499 and 500:
In the descriptive approach, howeve
- Page 501 and 502:
ORGANIZING INFORMATION One differen
- Page 503 and 504:
As has already been stated, the for
- Page 505 and 506:
Figure 7.--Matrix of interactions b
- Page 507 and 508:
understory biomass density, X2 repr
- Page 509 and 510:
or, by rearrangement, AX. I afi Ax,
- Page 511 and 512:
DISCUSSION It is important to note
- Page 513 and 514:
LITERATURE CITED Billings, W. D. 19
- Page 515 and 516:
Richard T. Wick Burlington Northern
- Page 517 and 518:
themselves, the traditional industr
- Page 519 and 520:
highways. Of course, all roads are
- Page 521 and 522:
Darrel L. Kenops District Ranger US
- Page 523 and 524:
In the future we will see our const
- Page 525 and 526:
Lyon, L. Jack, Project Leader, Ecol
- Page 527:
The Intermountain Station, headquar